Washington DC Grows Green

Data, Heat, and Trees: How GIS Helped Washington, DC Grow Green Where It Matters Most

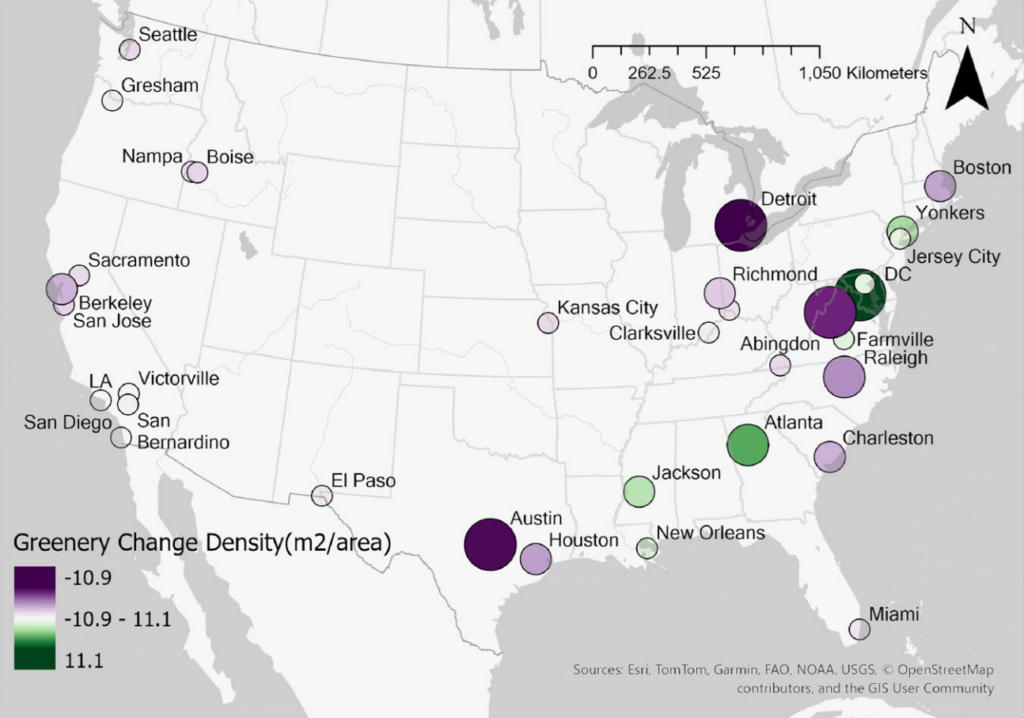
A newly published national study on urban greenery just delivered remarkable news: Washington, DC recorded the largest size-adjusted increase in urban greenery among 33 major U.S. cities between 2013 and 2022.
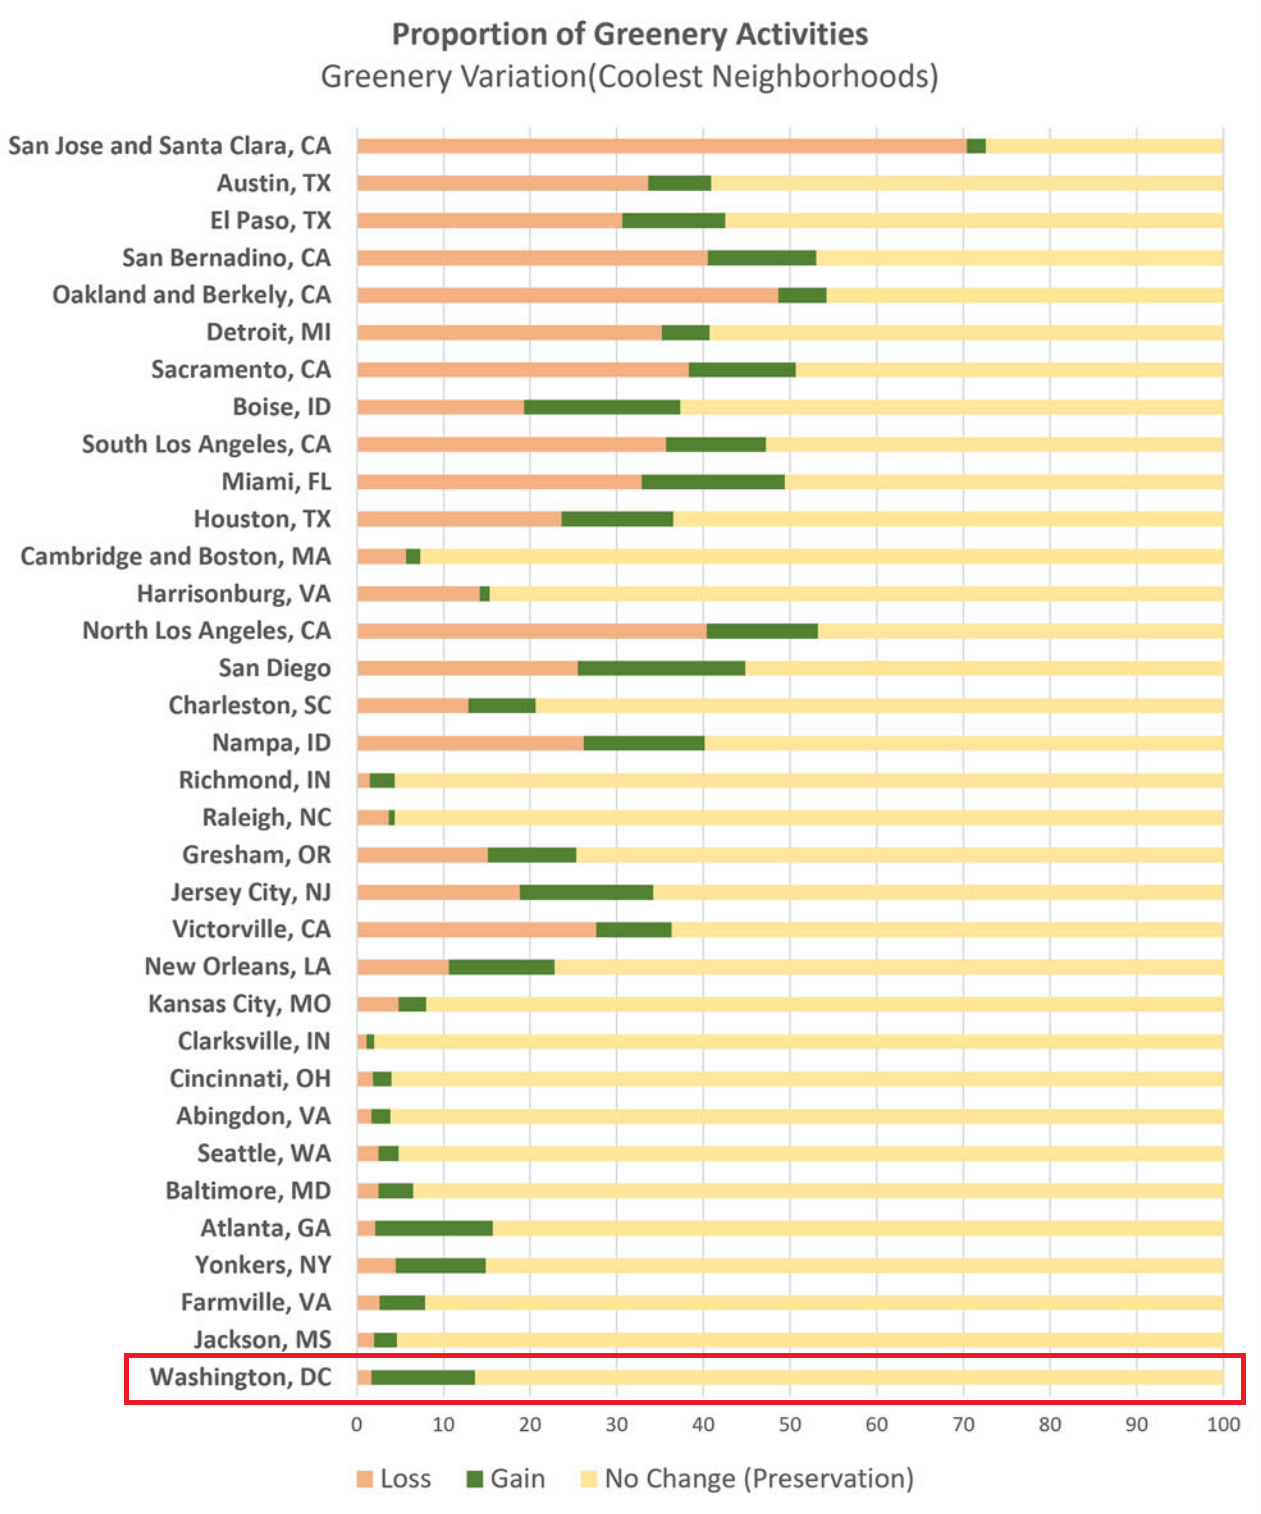
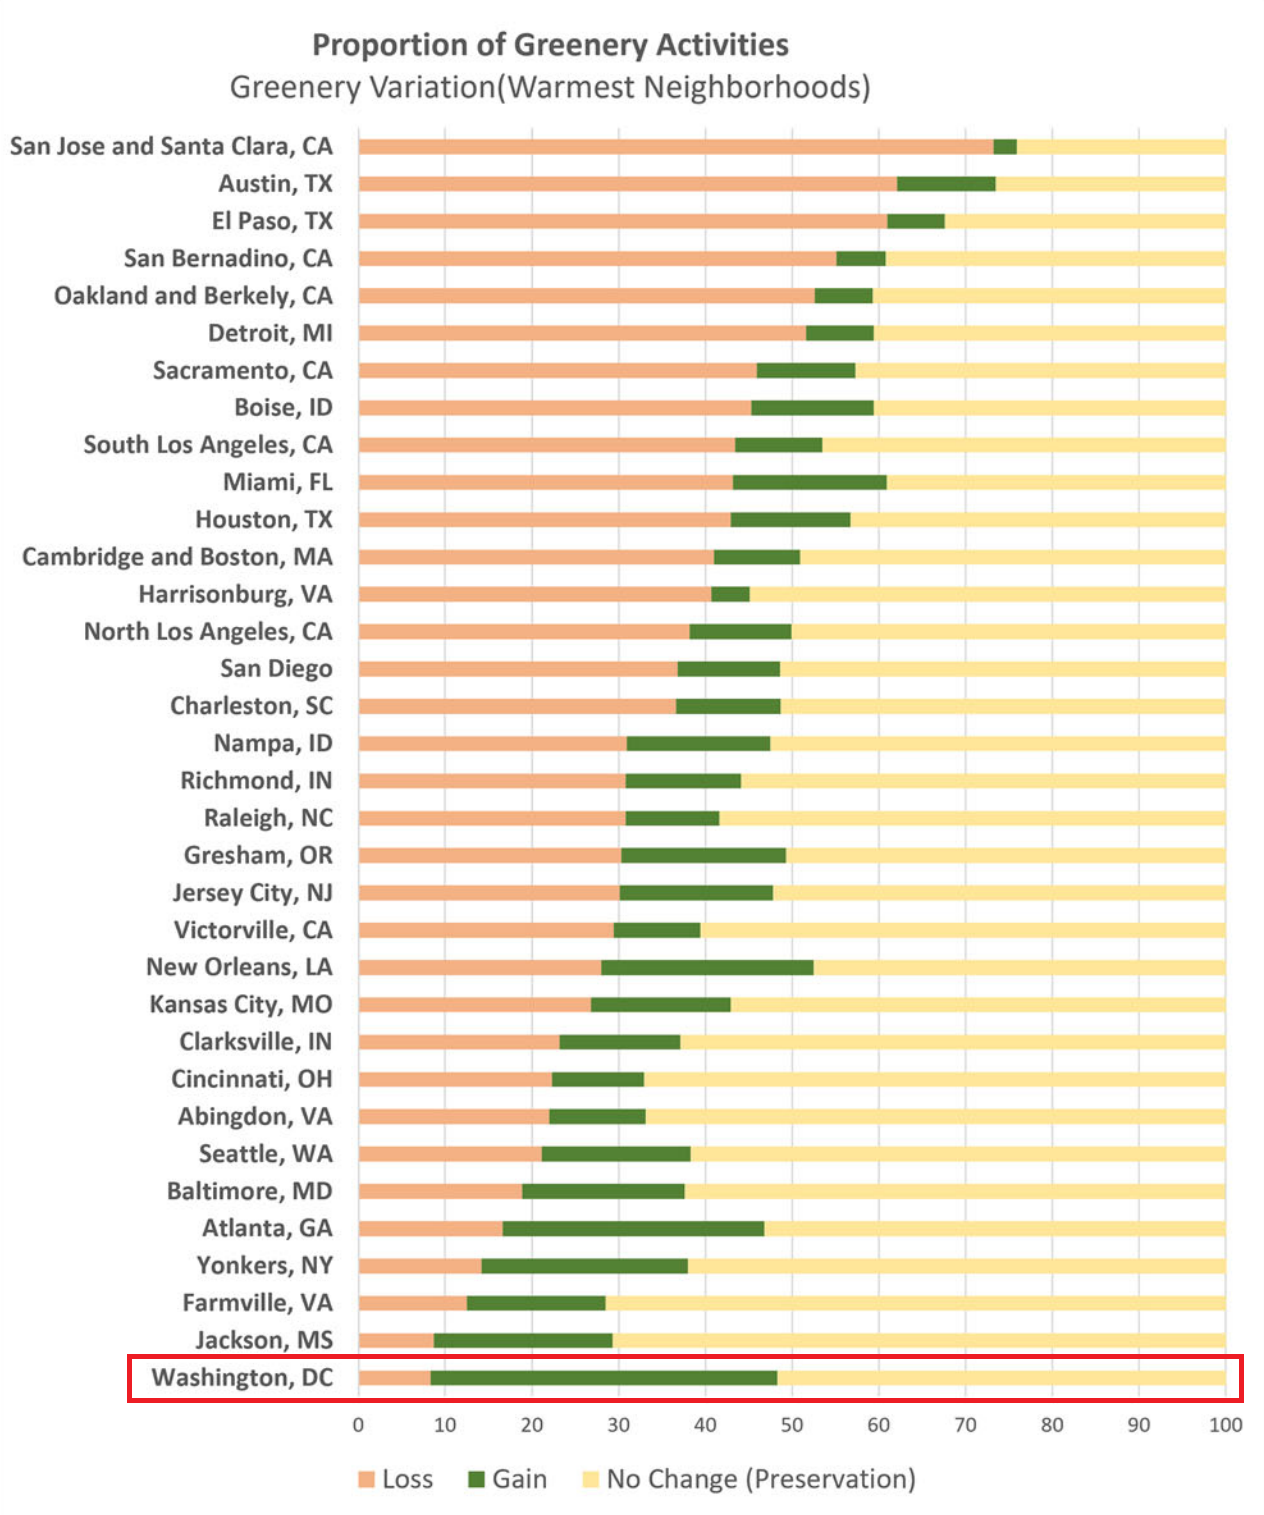
Even more significant is that DC’s hottest neighborhoods gained more greenery than its coolest neighborhoods. In a national landscape where most cities are losing vegetation (especially in heat-vulnerable areas), the District reversed the trend.
This didn’t happen by accident. And it didn’t happen by planting trees randomly. It happened because planting decisions were guided by data.
The National Context: A Troubling Pattern

The study, led by urban heat researcher Vivek Shandas, found:

  • 73% of cities analyzed experienced an overall decline in greenery.
  • The hottest neighborhoods were typically losing greenery the fastest.
  • Canopy inequity is increasing in most urban areas.

Washington, DC stood apart. Not only did the city increase greenery overall, it was one of only three cities where hotter neighborhoods gained more greenery than cooler ones – and the only city where the gain exceeded 20% in its hottest areas. That is a measurable reversal of a national environmental equity trend.
The Role of GIS: Moving From Planting to Strategy

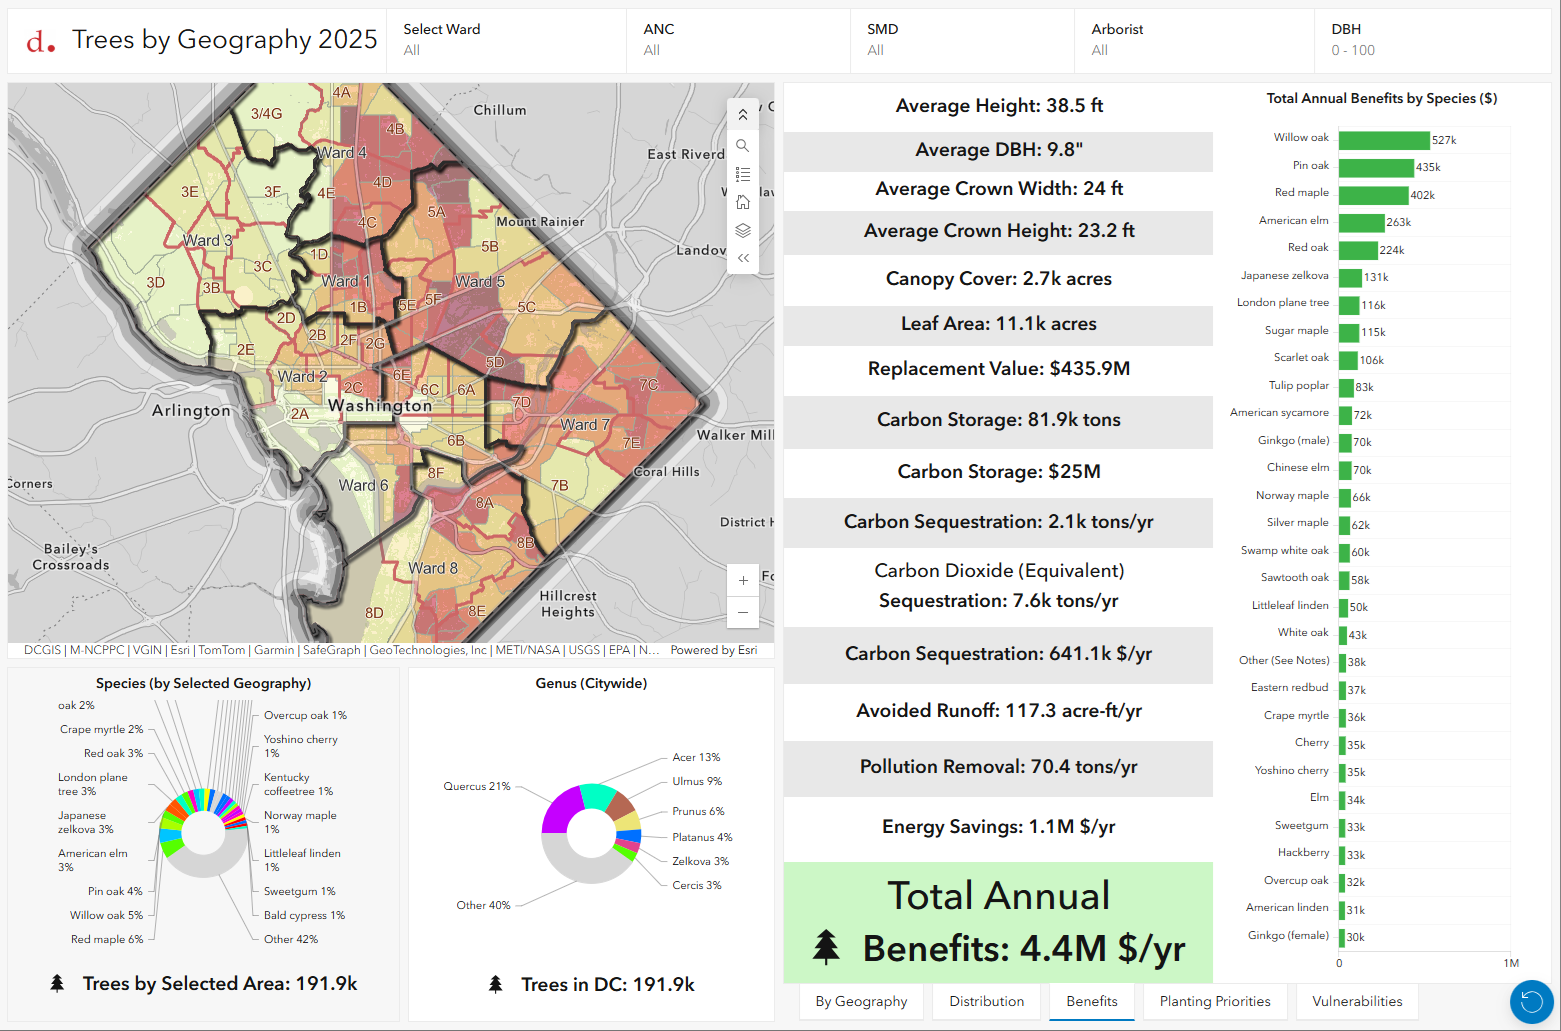
For more than two decades, the District Department of Transportation (DDOT) Urban Foresty Division has invested in a highly intentional urban forestry program. A core component of that effort has been the sustained use of Esri’s ArcGIS platform to analyze conditions, identify opportunities, and guide resource allocation.

SymGEO has supported that work over the last 8 years by helping structure and operationalize the analytics behind those decisions.

The work has included:

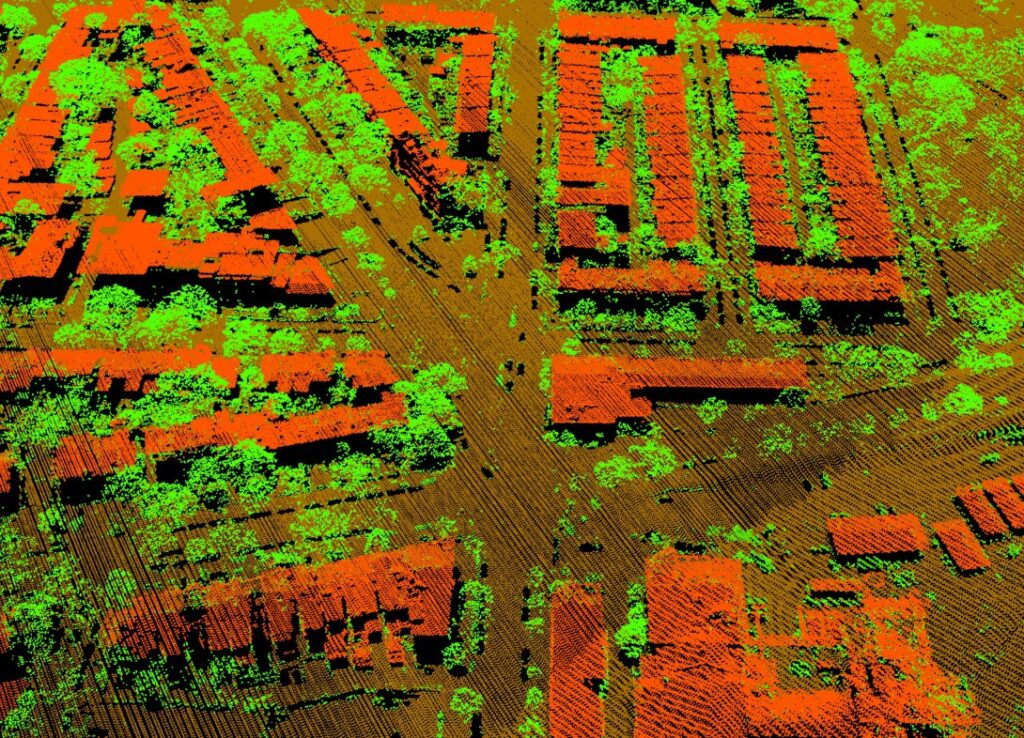
  • Mapping canopy change over time
  • Analyzing urban heat distribution and vulnerability
  • Identifying planting gaps within the public right-of-way
  • Integrating operational tree data with spatial equity metrics
  • Supporting defensible, transparent prioritization frameworks

Rather than asking “Where can we plant trees?” the analysis reframed the question to: “Where will planting have the greatest long-term environmental and equity impact?”

GIS allowed DDOT to see patterns that are invisible without spatial analysis – and to align investments accordingly.
The Results: Quantifiable Impact

The national study confirms what sustained, data-informed planning can accomplish:

  • Washington, DC had the largest greenery increase when adjusted for city size.
  • The hottest neighborhoods gained 28% more greenery than the coolest neighborhoods.
  • On average, the hottest areas gained 4% more greenery per grid cell – roughly 900 square meters of additional vegetation.
  • DC was one of only two cities where greenery loss in the hottest neighborhoods remained below 10%.

These outcomes align with steady increases in tree canopy within the public right-of-way since 2006. Importantly, this reflects long-term consistency – not a one-year initiative.
Why This Matters

Urban heat is infrastructure stress, and tree canopy is climate infrastructure. When planting decisions are driven by spatial analytics instead of intuition, cities can:

  • Reduce heat vulnerability
  • Address inequitable canopy distribution
  • Improve air quality and stormwater performance
  • Maximize return on public investment

Technology alone doesn’t plant trees, but technology can ensure they’re planted where they matter most.
The Bigger Lesson

This story is not about a single dataset or a single program. It’s about what happens when:

  • Agencies commit to long-term data governance
  • Spatial analysis informs operational workflows
  • Equity metrics are embedded into decision-making
  • Progress is measured over time

GIS becomes more than mapping – it becomes a strategic planning framework. The Washington, DC results demonstrate that when cities combine sustained operational excellence with rigorous spatial analytics, measurable climate equity outcomes are possible.
At SymGEO, we’re proud to support that kind of work – helping public agencies translate data into durable environmental impact.

The work is ongoing, the analysis continues, and the canopy keeps growing. More information at: https://trees.dc.gov/pages/dc-national-leader

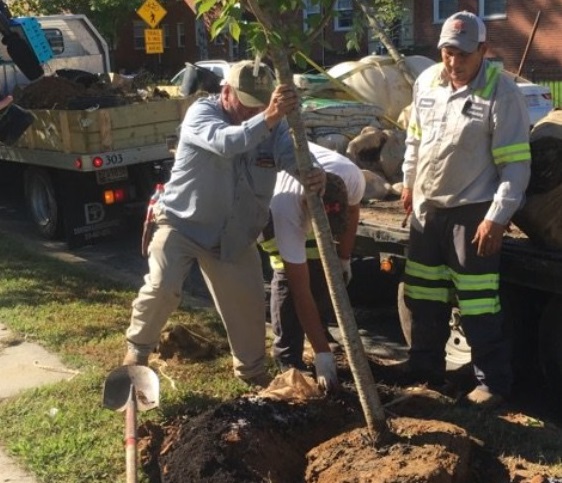
Images used courtesy of DDOT Urban Forestry Division
Greensboro’s Tree Canopy Assessment & Planting Hub

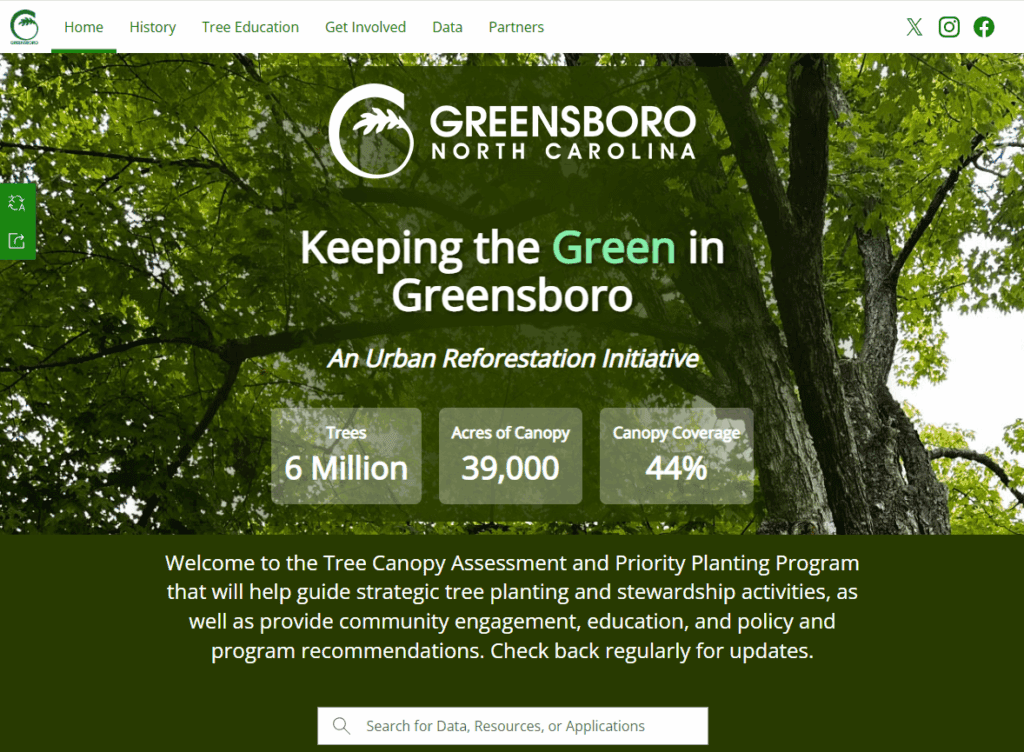
SymGEO is proud to announce the launch of the City of Greensboro’s Tree Canopy Assessment and Priority Planting Program hub site!

This platform is the result of a collaborative effort between Planning Communities (project lead), SymGEO, Breece Robertson Consulting, and the Office of Sustainability and Resilience for the City of Greensboro, NC. The hub is designed to guide strategic tree planting and stewardship efforts, while also supporting community engagement, education, and policy and program recommendations to grow and protect Greensboro’s tree canopy.

Built on Esri’s ArcGIS Hub technology, the site leverages ArcGIS StoryMaps, Dashboards, and Survey123 to create an interactive experience for residents and tree-planting partners, making it easier than ever to explore Greensboro’s urban forest and get involved.

“The hub is an amazing visualization of multiple data points and information uniting on one platform – solidifying a need for continuous growth in Greensboro, one tree at a time!”

– Chief Sustainability Officer, City of Greensboro NC 

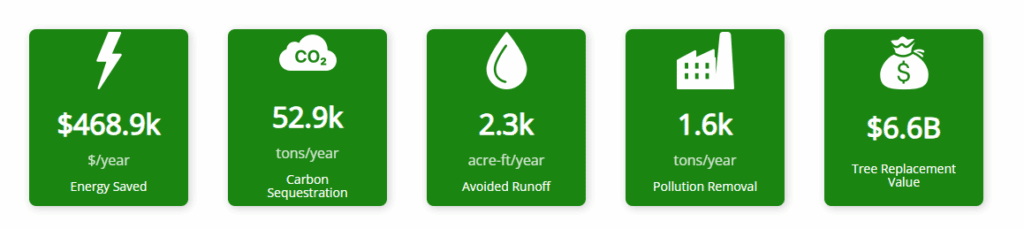
The hub features quick facts and figures about the tree canopy and its benefits, along with other reports and future plans for the City’s urban forest.

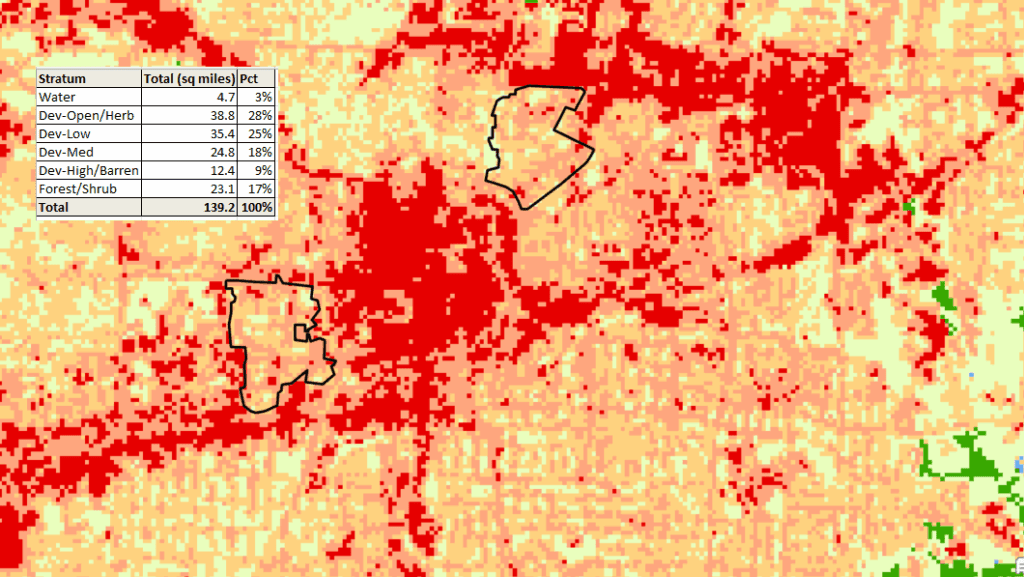
SymGEO led Greensboro’s tree canopy assessment by combining advanced spatial data processing, statistical analysis, and environmental benefit modeling. Using Deep Learning in ArcGIS Pro, high-resolution imagery was classified into distinct land cover types and paired with National Land Cover Data to build a detailed picture of the city’s landscape. Insights from 5,000+ sampled trees were expanded citywide using Forest Inventory Analysis methods, providing a statistically reliable estimate of tree canopy conditions across Greensboro. These results were then processed through i-Tree Eco tools to calculate the environmental benefits that trees provide—such as cleaner air, stormwater management, energy savings, and improved quality of life. This assessment equips city leaders and residents with valuable information to guide urban forestry decisions, prioritize tree planting, and maximize the community benefits of Greensboro’s urban canopy.

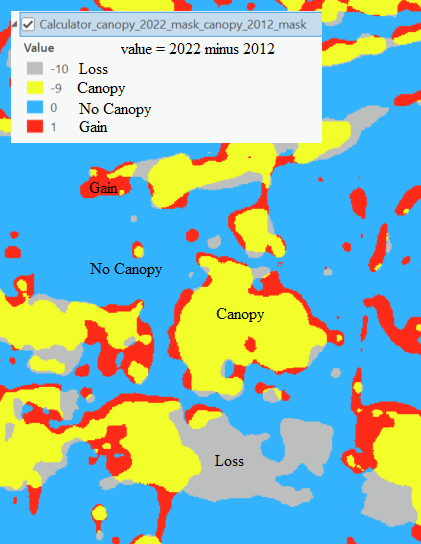
The Deep Learning classification method was repeated using historic imagery and then compared to current results to show areas of canopy loss, gains, and future planting opportunities (potential planting areas).

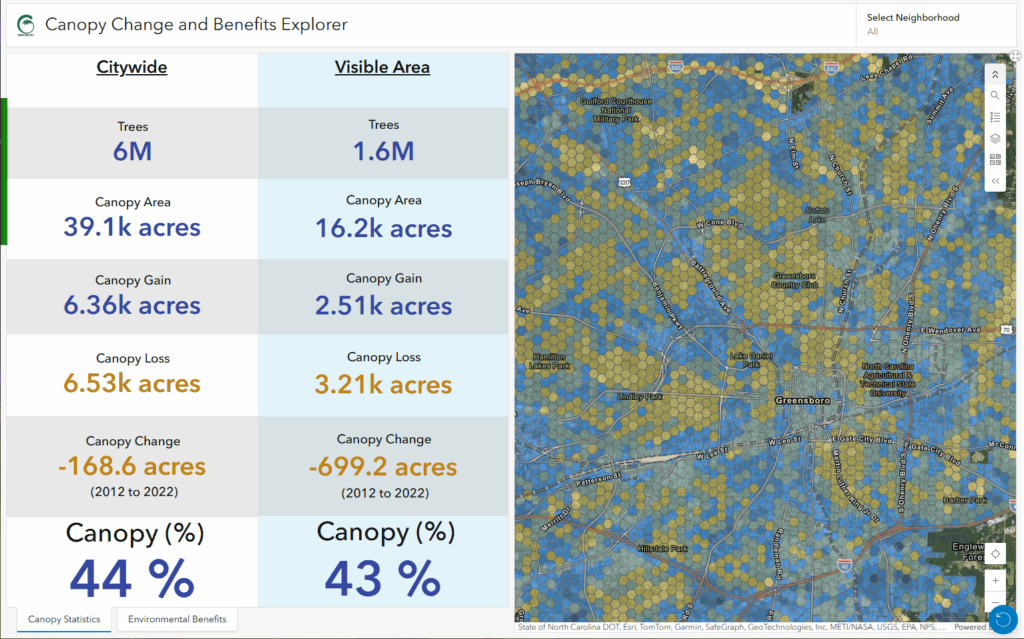
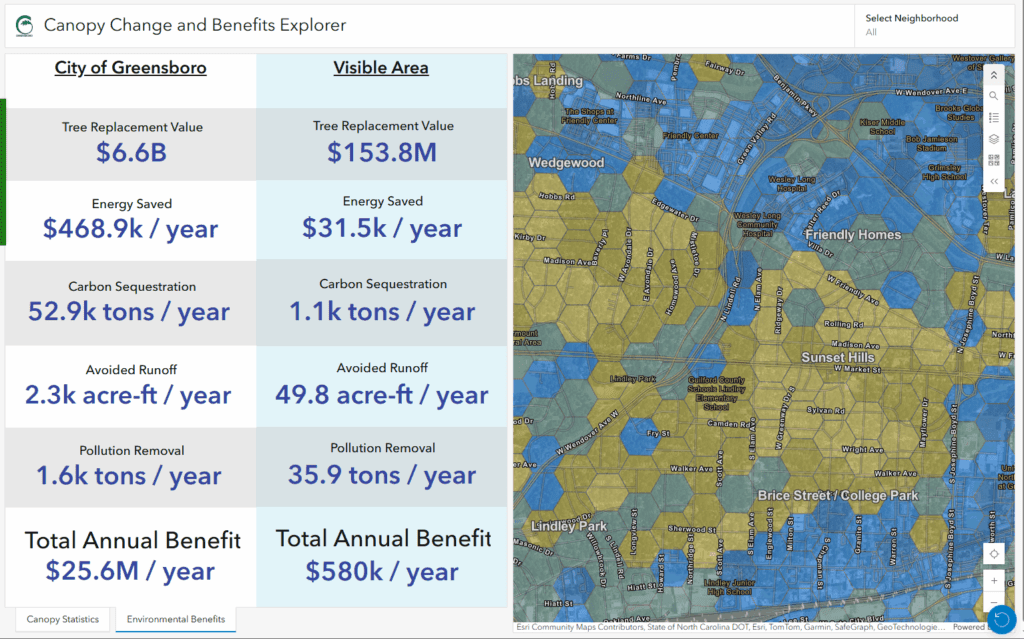
Canopy statistics were summarized in a dashboard featuring both canopy changes and environmental benefits.

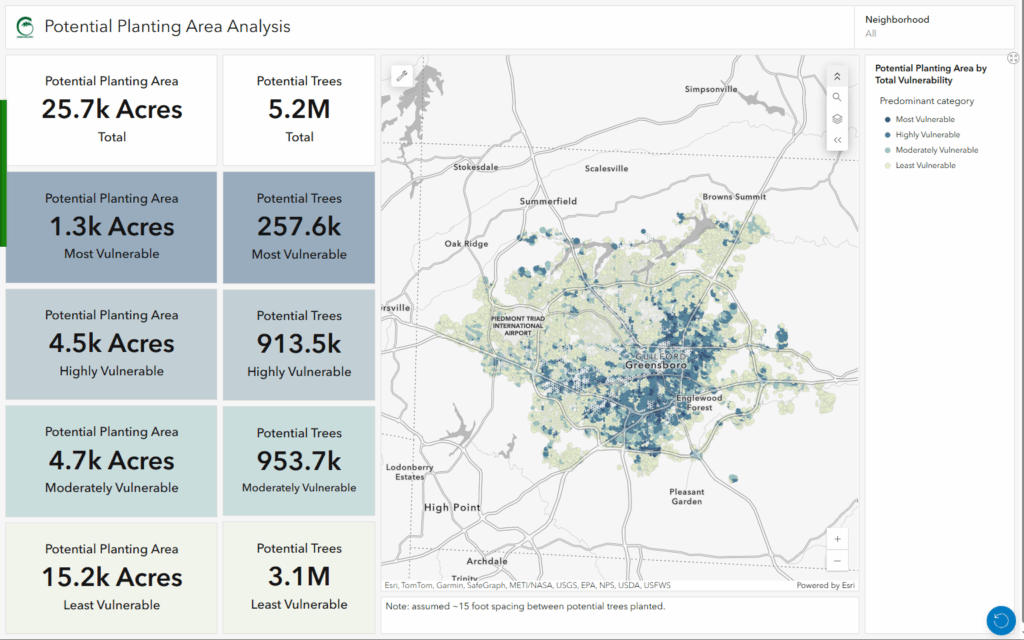
The results of the canopy assessment were combined with a detailed vulnerability assessment performed by Planning Communities and summarized in an interactive dashboard that shows where planted trees would provide the greatest benefit.

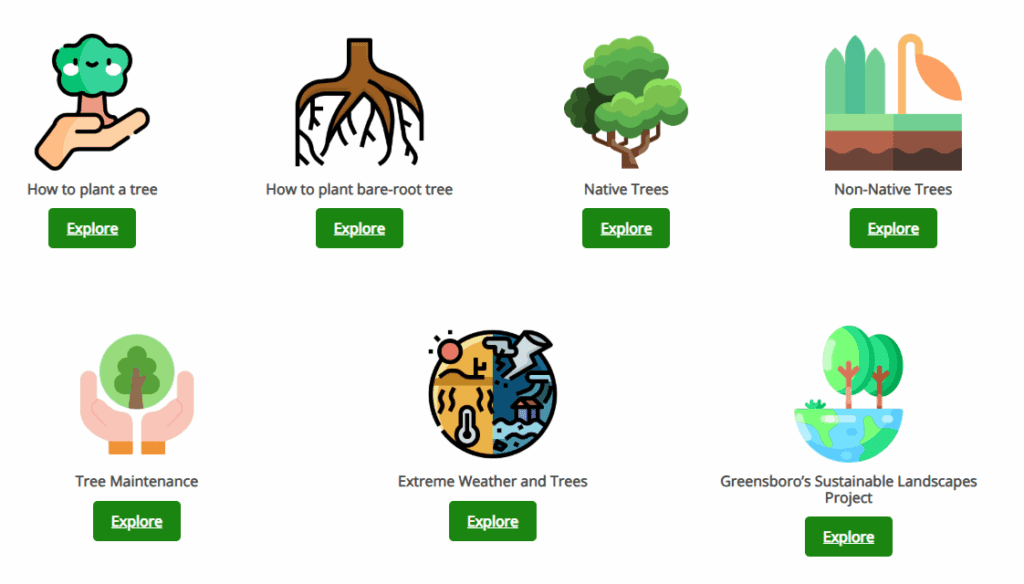
The hub site also features a resource section that facilitates the exploration of best practices regarding planting, maintaining, and planning for future trees.

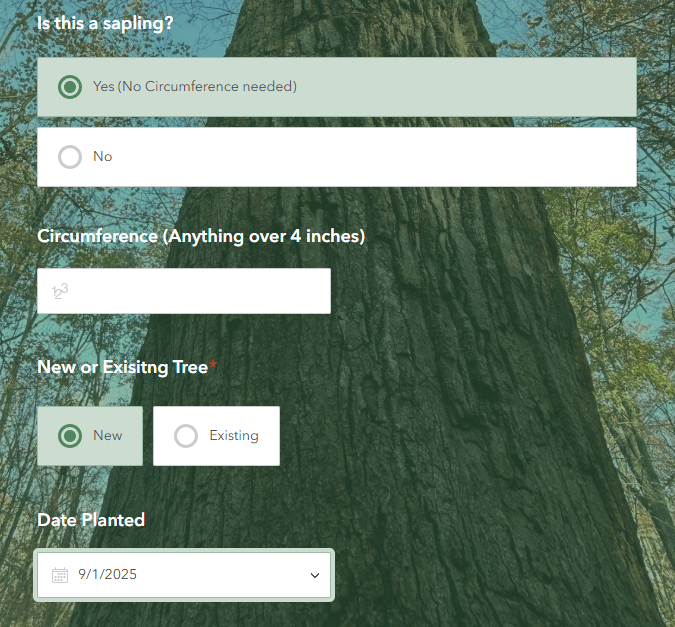
A survey to capture new trees planted by residents was built using Survey123 and encourages 2-way stakeholder engagement.

“Creating a place for the citizens to interact with their data in a useful way was a high priority for this project. Every Hub element and dashboard was designed to get the residents to understand how the canopy impacts their house, their neighborhood, and the city as a whole.”

– GIS Analyst, City of Greensboro NC 

Talk to our industry experts if your agency or organization is interested in conducting a canopy assessment or leveraging the power of Esri’s ArcGIS Online and analytical technology – SymGEO is here to help!

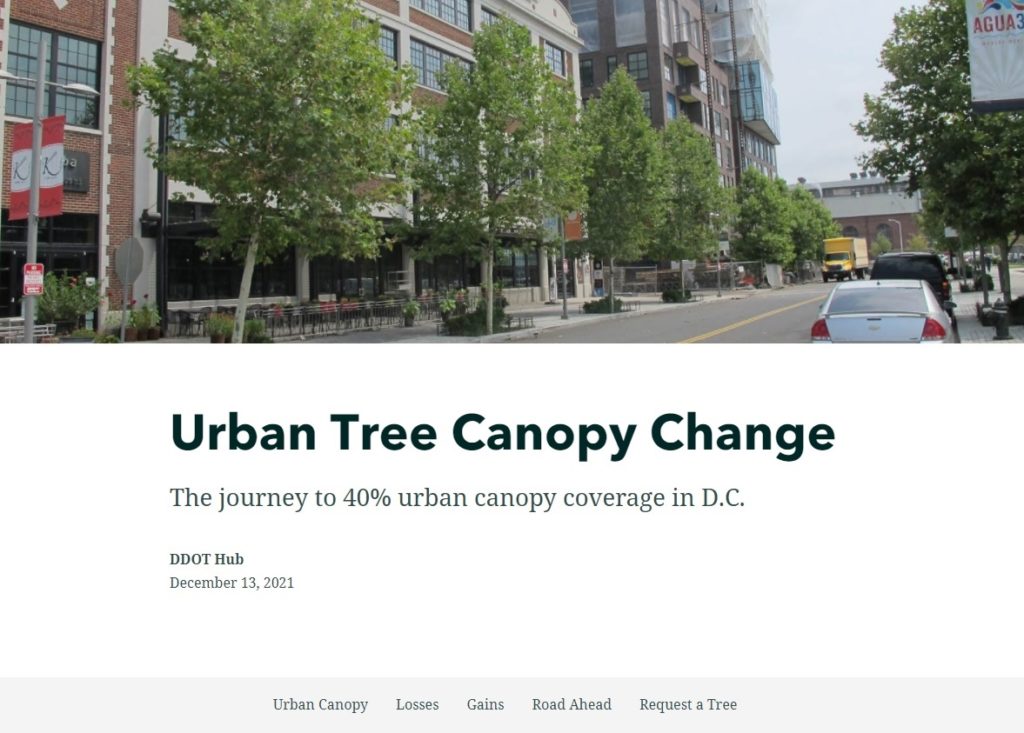
Urban Tree Canopy Change Storymap

DDOT’s Urban Forestry Division (UFD) is the primary steward of Washington, D.C.’s ~175,000 public trees and has a mission of keeping this resource healthy, safe, and growing. Among many other benefits, these trees improve our air and water quality, cool our neighborhoods, and provide critical habitat for many animals. While D.C.’s Urban Tree Canopy (UTC) is already at an impressive 38%, the UFD has a goal of 40% by 2032. To learn more about the gains and losses experienced during the journey to 40%, SymGEO recently partnered with the UFD to create a StoryMap that explores example areas throughout D.C. and lays out the steps needed to reach the 40% canopy coverage goal.

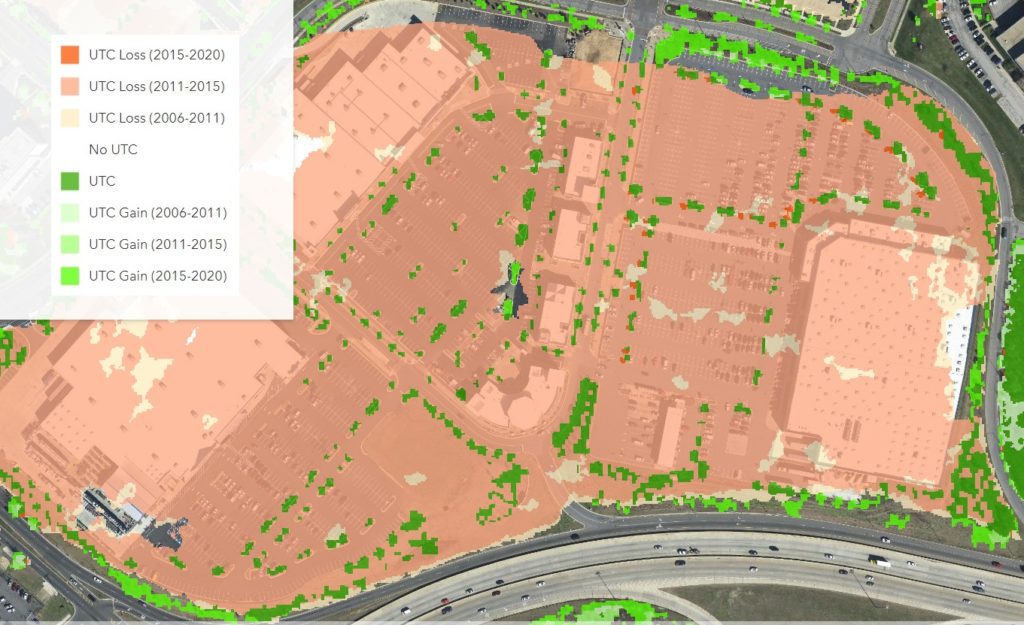
This mobile-responsive story begins with an overview of the current canopy coverage in DC and explores select examples detailing areas of loss and areas of gain.

Areas of loss are typically due to commercial developments, new residential developments, supporting road and transportation infrastructure, or individual tree loss due to natural causes or storm damage. 

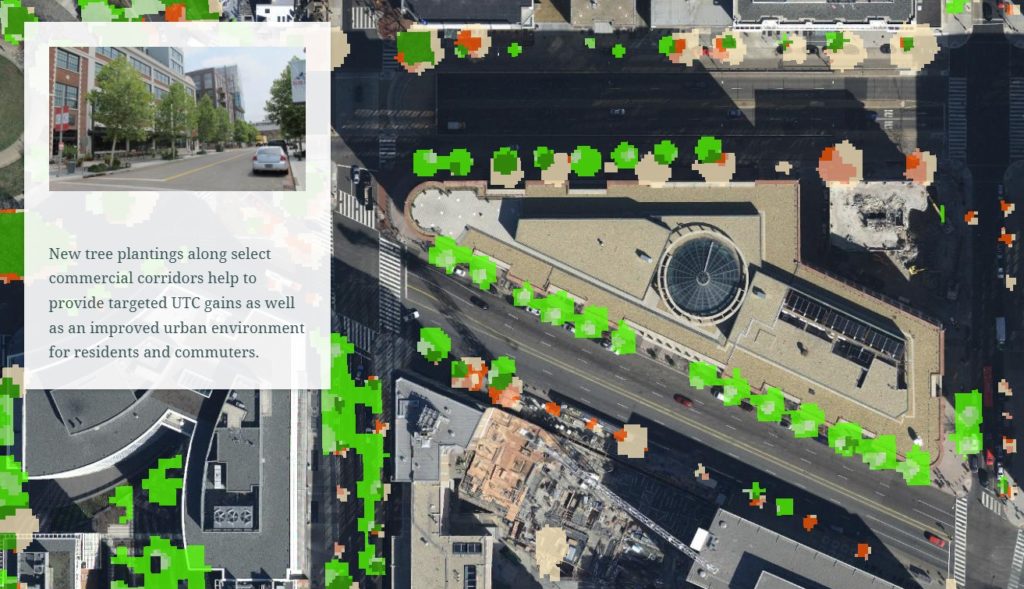
Areas of gain can be attributed to plantings along commercial corridors, or in new residential developments to help alleviate the urban heat island effect, or due to the natural growth of trees over time.

Finally, a call to action is made for homeowners to request their own free shade-providing tree, or to report an open planting box ready for a new tree.

Talk to SymGEO industry experts today if your agency or organization is interested in community engagement with the power of Esri’s ArcGIS StoryMap technology –  we are a certified Esri business partner and are here to help.