Flood Impact Visualization

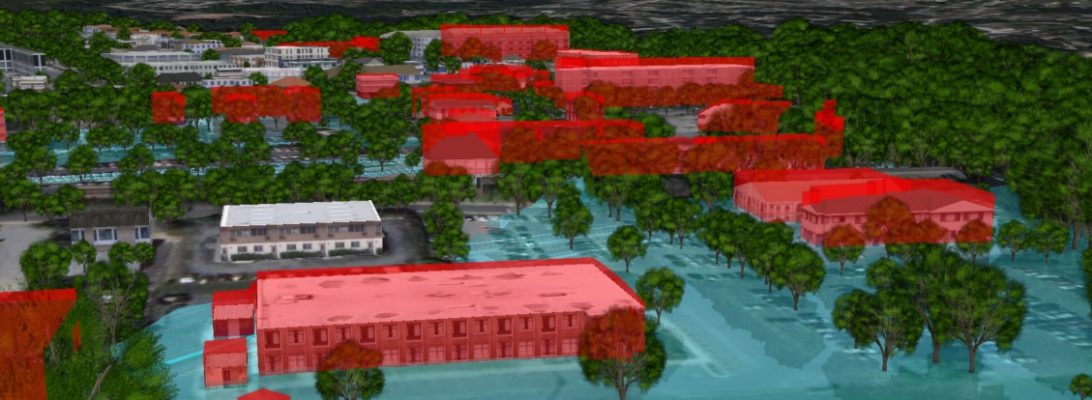
SymGEO is excited to demonstrate flood visualization technology built on the Esri Local Government 3D Basemap Solution.  In this example, the City of Laurel, Maryland, has a number of buildings that are located in the floodplain and are therefore at risk of flooding. This information can be conveyed using the FEMA National Flood Hazard Layer (NFHL) Viewer as shown below, but we decided to bring this data to life using an Esri ArcGIS Solution instead!
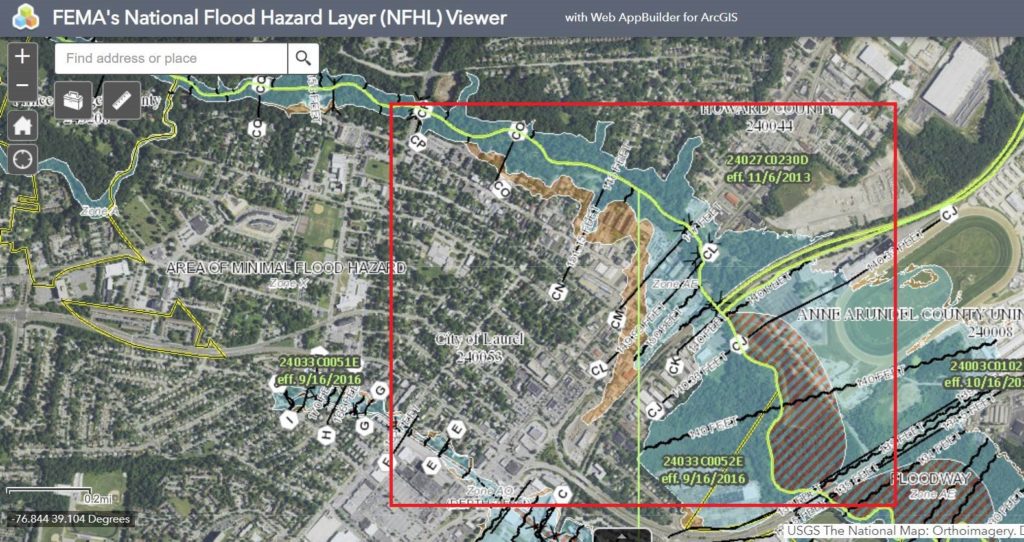
Our journey began with a virtual trip to the Maryland iMap GIS data portal to download the best-available LiDAR data for our area of interest. We then visited the Maryland-National Capital Park and Planning Commission GIS Open Data portal to get building footprint information. Finally, after following the defined steps in the ArcGIS Local Government Solution, we were able to visualize flood impacts in realistic 3D from citywide to local perspectives.
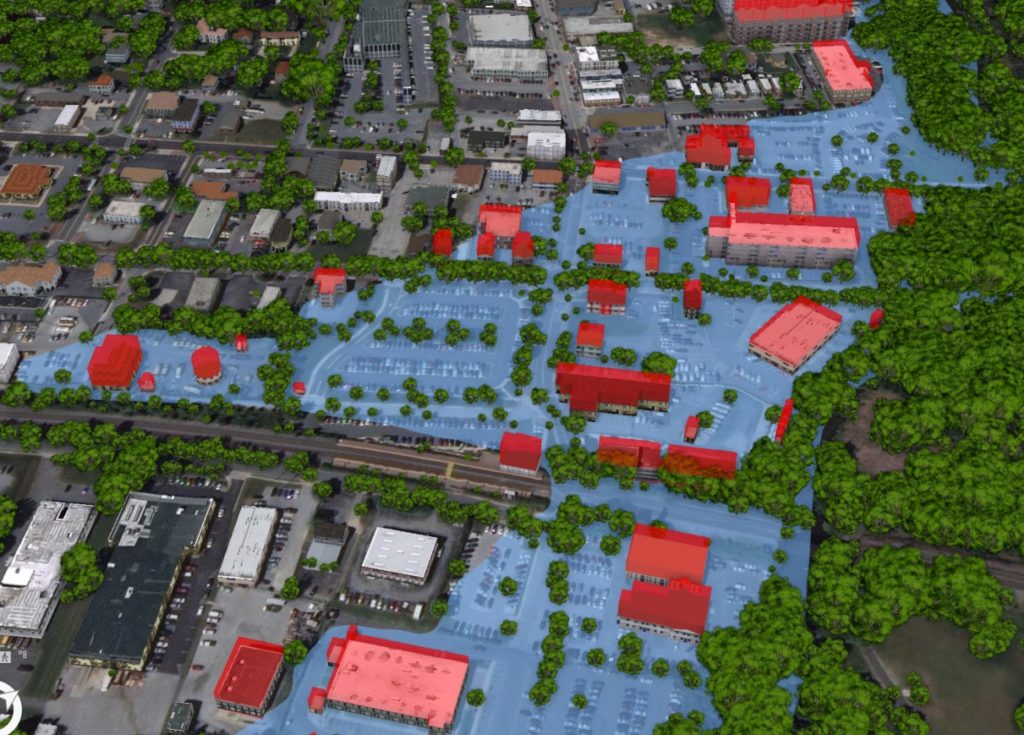
Realistic building textures, vegetation, and current imagery allow the user audience to recognize features and landmarks during demonstrations. Streets can be labeled, and buildings of interest can be highlighted with either labels or colors to call attention to focus areas.
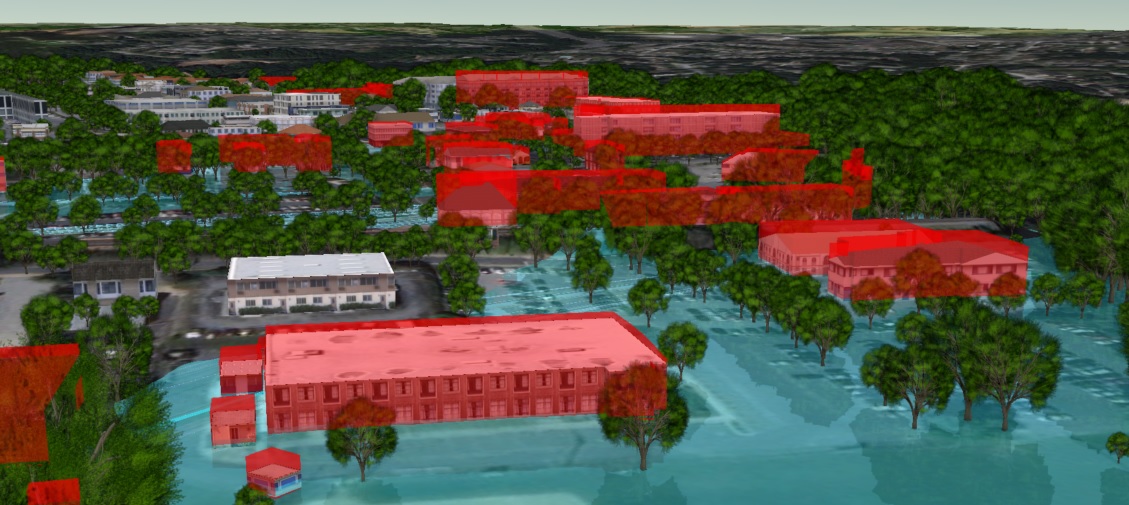
Continual improvements using Esri’s 3D rendering and animation technology enable fly-throughs, call-outs, layer transitions, time-lapse visualizations, and other features and functionality that make this 3D basemap solution the perfect tool to communicate risk and mitigation plans.

Contact SymGEO for your 3D visualization and communication needs and start a conversation today!
One Main Street Initiative

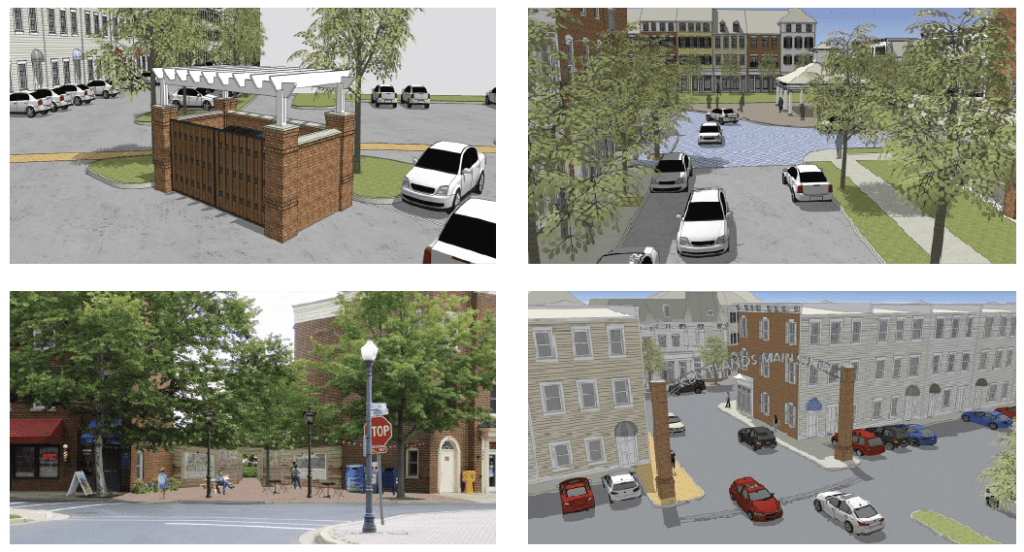
SymGEO is pleased to launch the One Main Street Initiative website produced in collaboration with our local commercial development volunteer committee. This website is powered by ArcGIS Hub technology and is designed to engage business owners and residents in the transformation of the Main Street of Kentlands into a vibrant, family-friendly, retail destination. This was accomplished by summarizing the key findings of a detailed local study conducted by Live Work Learn Play that charted a path forward to energize the Main street through a combination of events, physical improvements, dedicated leadership, and community involvement.

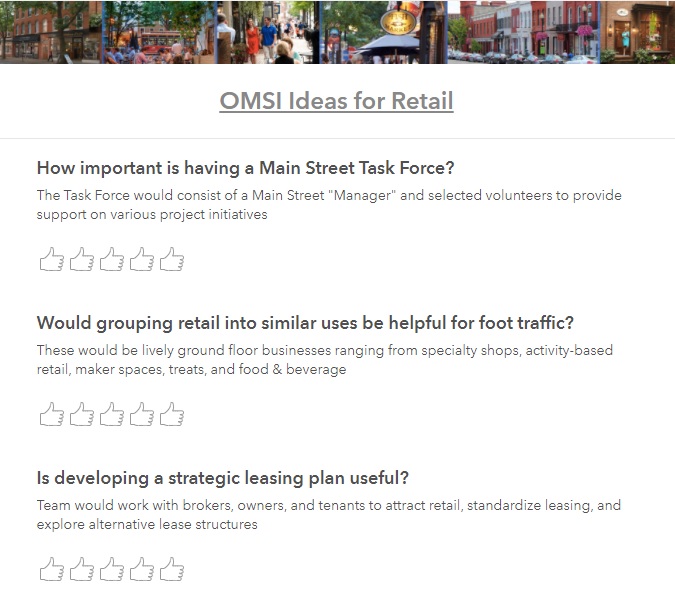
Each key component of the study was summarized and shared using a combination of text and graphics to facilitate community understanding, discussion, and evaluation.

After presenting the key findings, ArcGIS Survey123 was used to gauge public reaction to the importance of each component.

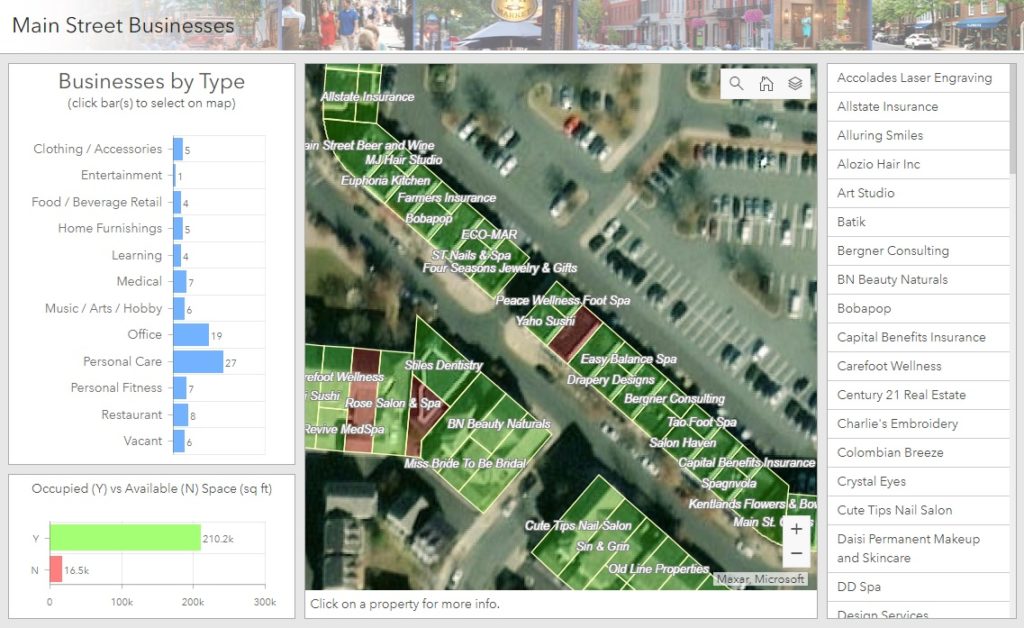
Finally, ArcGIS Dashboards was leveraged to create and share a helpful Main Street Explorer tool (desktop or mobile) for residents to see which businesses are already on Main street and where opportunities for new businesses are located.

Talk to our industry experts today if your community is interested in harnessing the power of Esri’s ArcGIS Hub to share and amplify your development plans – SymGEO is here to help!

COVID-19 Honduras

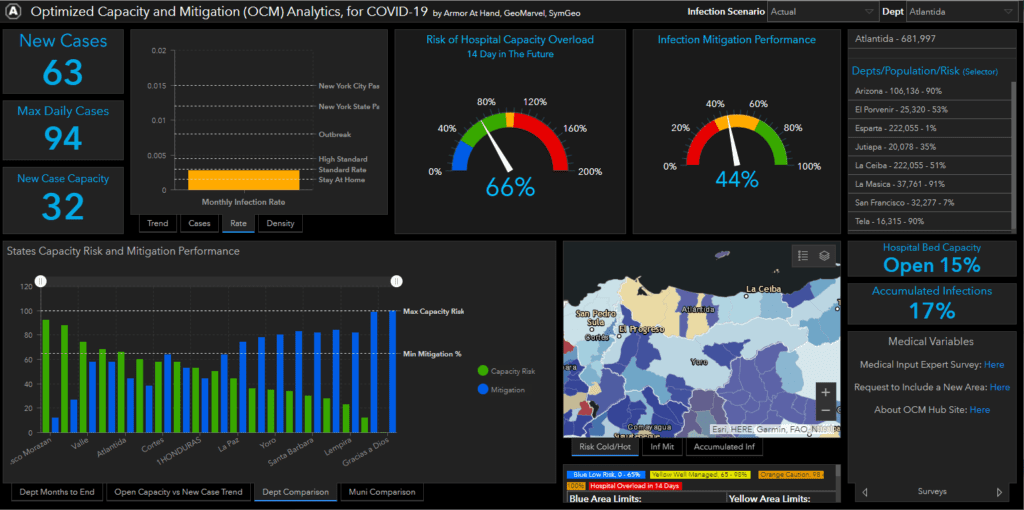
When our collaborative partners at Armor at Hand asked us if we were willing to continue our pro-bono work to fight the devastating effects of COVID-19 and help the people of Honduras, we didn’t hesitate. The result of this international work can now be seen in the Optimized Capacity and Mitigation (OCM) Honduras Dashboard.

This dashboard leverages data specific to Honduras and is a variant of the US version. This required significant updates to the modeling process and data files as well as a reconfiguration of the dashboard to reference the new data schemas. ArcGIS Online Assistant was used to facilitate the substitution of ArcGIS web maps and data services, and a new python script was developed to keep the Honduras data current.

For more information about the data model developed by Armor at Hand that powers the dashboard, check out the OCM Hub page, OCM whitepaper, or OCM ArcGIS Marketplace listing.

Talk to our industry experts today to help you leverage your spatial data with an ArcGIS Dashboard, ArcGIS Hub site, or the ModelBuilder process – SymGEO is here to help!

Tree Preservation

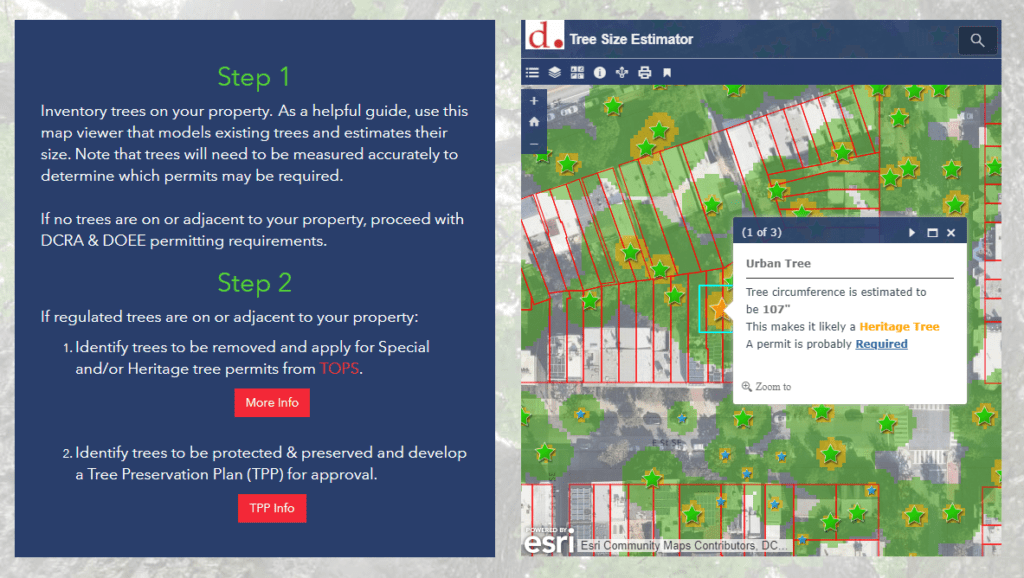
Did you know that trees are so important to Washington DC that they are protected by the Urban Forest Preservation Act and the Tree Canopy Protection Act? This means that before performing any excavation or construction activity on private property, it is important to consider any potential impacts to the trees on site. To facilitate this process, SymGEO is proud to help DDOT launch a new resource, the Tree Preservation Hub site, for property owners and construction companies to identify which trees need to be protected and how to best take care of them during home renovations or new construction projects.

tree preservation hub site

Built using ArcGIS Hub technology, this site leverages ArcGIS Online mapping and graphic examples to help explain what type of permit or protection plan is needed based on estimated tree size. Tree sizes were estimated using LiDAR processing, which in turn is used to estimate the critical root zone and structural root zones that need to be protected during construction. Modeling several hundred thousand trees at the same time has its challenges; however, ArcGIS Pro, ArcGIS Enterprise, Arcade expressions, and hosted image services were used to efficiently capture and share the modeling results.

Talk to our industry experts today if your agency or organization is interested in community engagement with the power of Esri’s ArcGIS Hub or data processing with ArcGIS Pro – SymGEO is here to help!