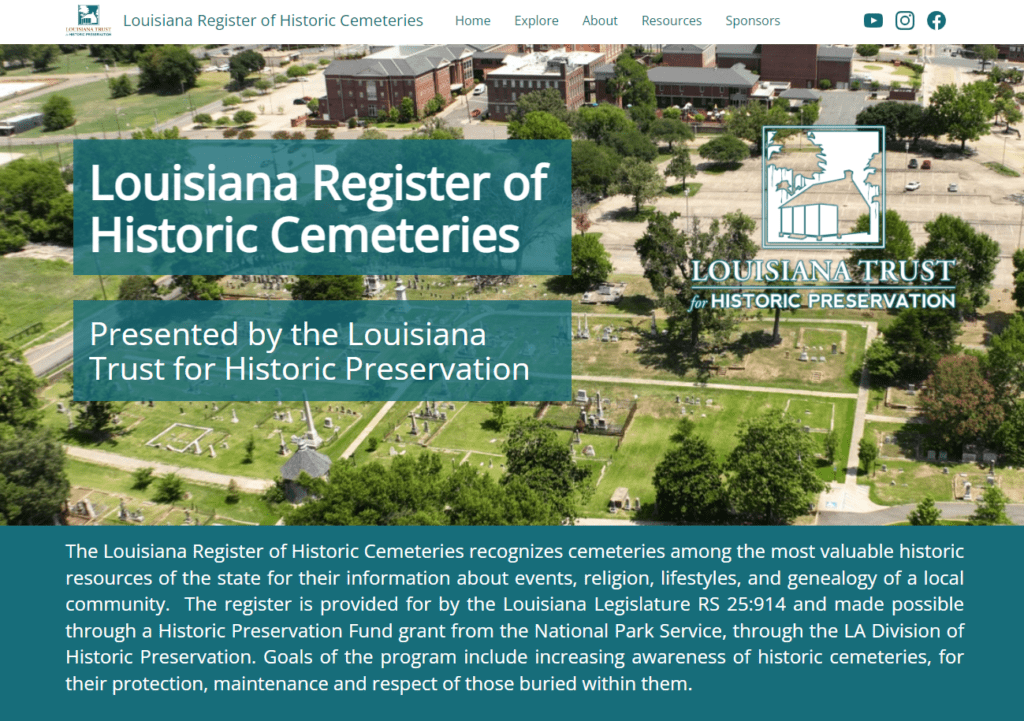
The Louisiana Register of Historic Cemeteries recognizes cemeteries among the most valuable historic resources of Louisiana for their information about events, religion, lifestyles, and genealogy of a local community. Recently brought to life by a Historic Preservation Fund grant awarded to the Louisiana Trust for Historic Preservation (LTHP) from the National Park Service, the goals of the program include increasing awareness of historic cemeteries, for their protection, maintenance and respect of those buried within them. As part of this important effort, SymGEO was honored to partner with LTHP to build the web infrastructure to house the historic cemetery data and enable stakeholders to contribute to this growing, interactive library.
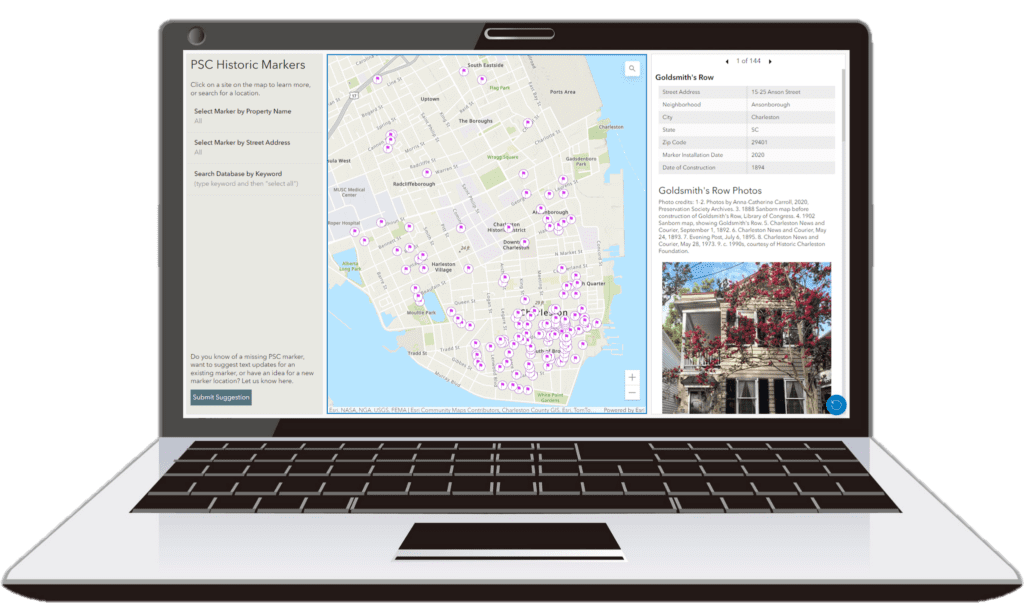
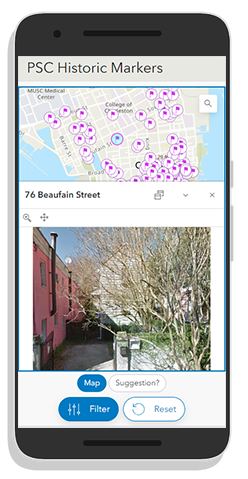
Built using ArcGIS Hub technology, the site features an interactive Historic Cemetery Dashboard that tracks all known historic cemeteries in Louisiana. Clicking on a cemetery icon will give basic information about the site, while cemeteries with detailed information and site pictures are differentiated by symbology.
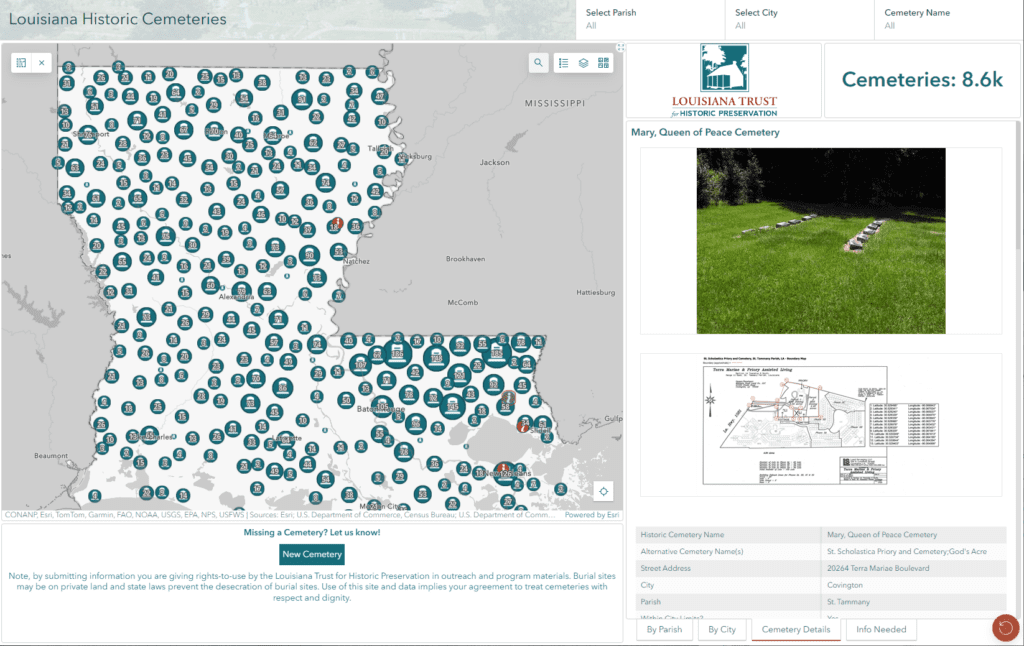
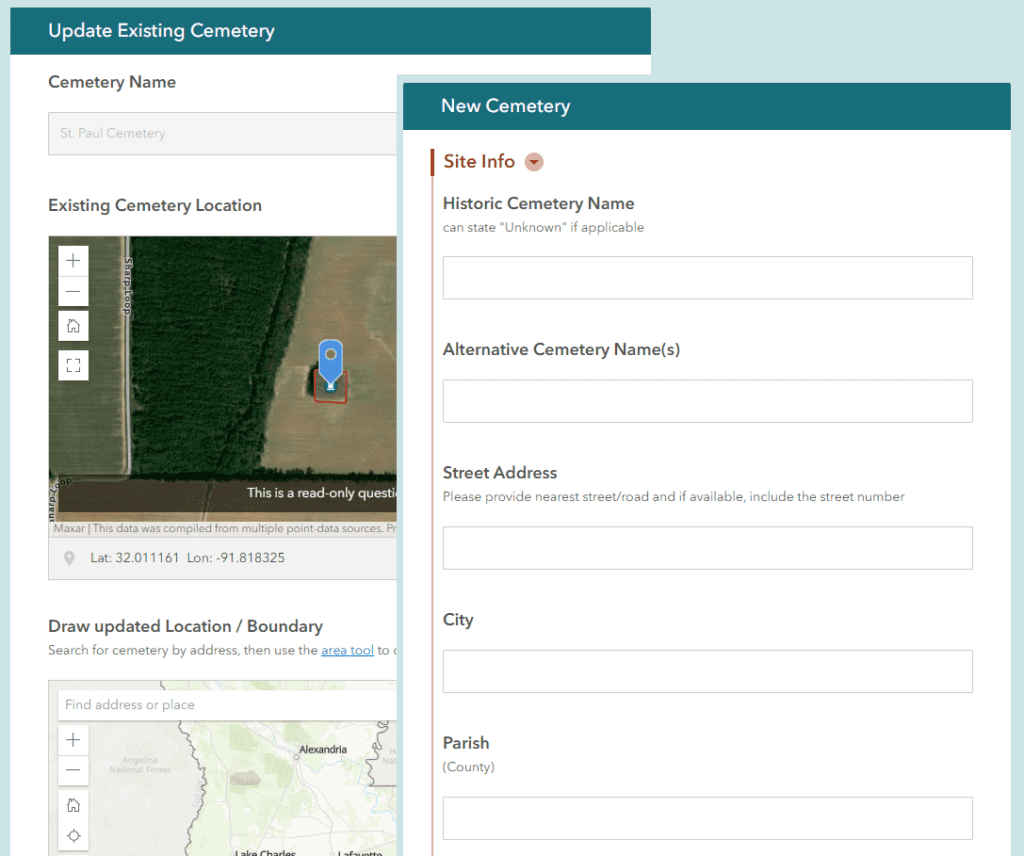
An innovative twist in the Dashboard is presented by the “Info Needed” tab, where users can see which cemeteries are missing names, locations, or boundaries. If they are familiar with a cemetery on the list (filtered by parish or city), they are presented with the option of updating either the basic geographic cemetery information, or completing a more detailed information form, including picture upload options.
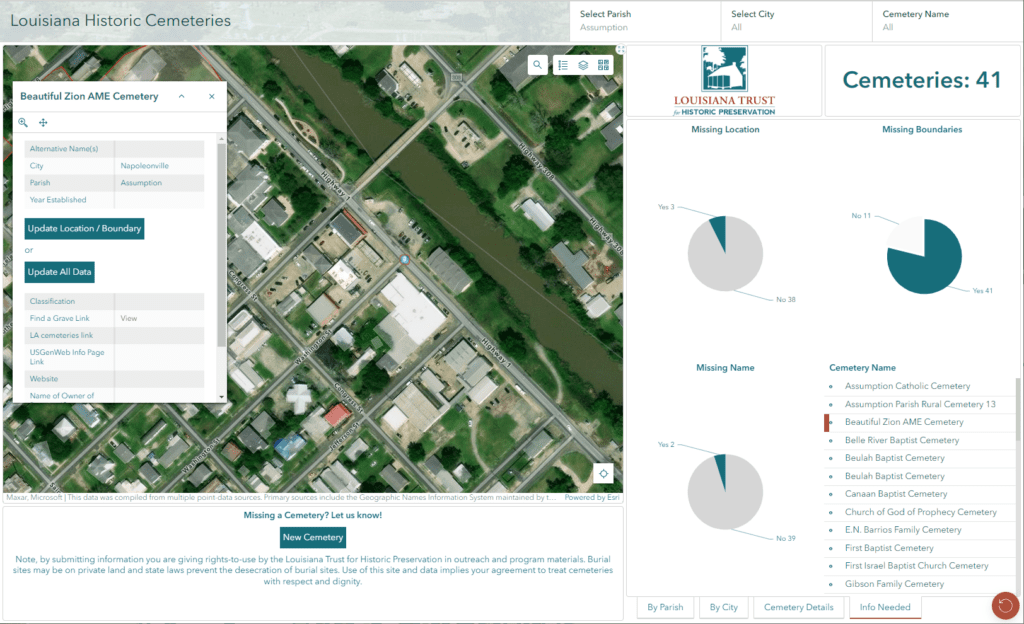
Built using ArcGIS Survey123, the forms include step logic to allow data updates or new cemetery information to be easily added to the growing collection of historic knowledge.
“The first step in protecting and respecting historic burials is to be aware of their location. By crowdsourcing this data beyond our initial research, we are able to learn about historic cemeteries in remote locations which may not appear on topographic maps or have even been used in over a century. The program will benefit descendants; industries such as tourism, real estate and construction; and should foster increased protection and maintenance at cemeteries.”
– Executive Director, Louisiana Trust for Historic Preservation
Talk to SymGEO today if your organization would like to feature projects or sites using the power of Esri’s ArcGIS Online platform – we are certified experts and here to help.