Hurricane Tracker

With Hurricane Florence rapidly approaching the Carolinas, the scale and power of the storm was truly terrifying. From eye of the hurricane video, provided by the NOAA Hurricane Hunter (9 second mark below), to overhead imagery from NOAA showing the churning vortex, it was only a matter of time before the devastating effects of the hurricane would be felt.


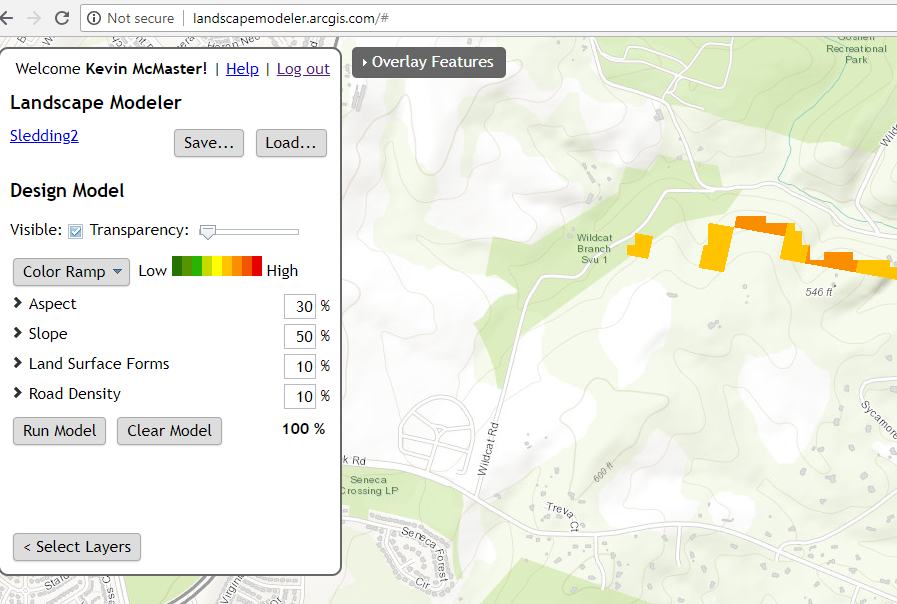
Armed with Esri technology and the thirst for knowledge, SymGEO explored the Living Atlas of the World data sets until we found The National Digital Forecast Database (NDFD).

“The NDFD was designed to provide access to weather forecasts in digital form from a central location. The NDFD produces gridded forecasts of sensible weather elements. NDFD contains a seamless mosaic of digital forecasts from National Weather Service (NWS) field offices working in collaboration with the National Centers for Environmental Prediction (NCEP). All of these organizations are under the administration of the National Oceanic and Atmospheric Administration (NOAA). Wind Gust is the maximum 3-second wind speed (in knots) forecast to occur within a 2-minute interval at a height of 10 meters. Wind gust forecasts are valid at the top of the indicated hour. This feed consumes NDFD’s files and calculates the amount of forecast wind gust for the next 72 hours.”

– from NDFD metadata

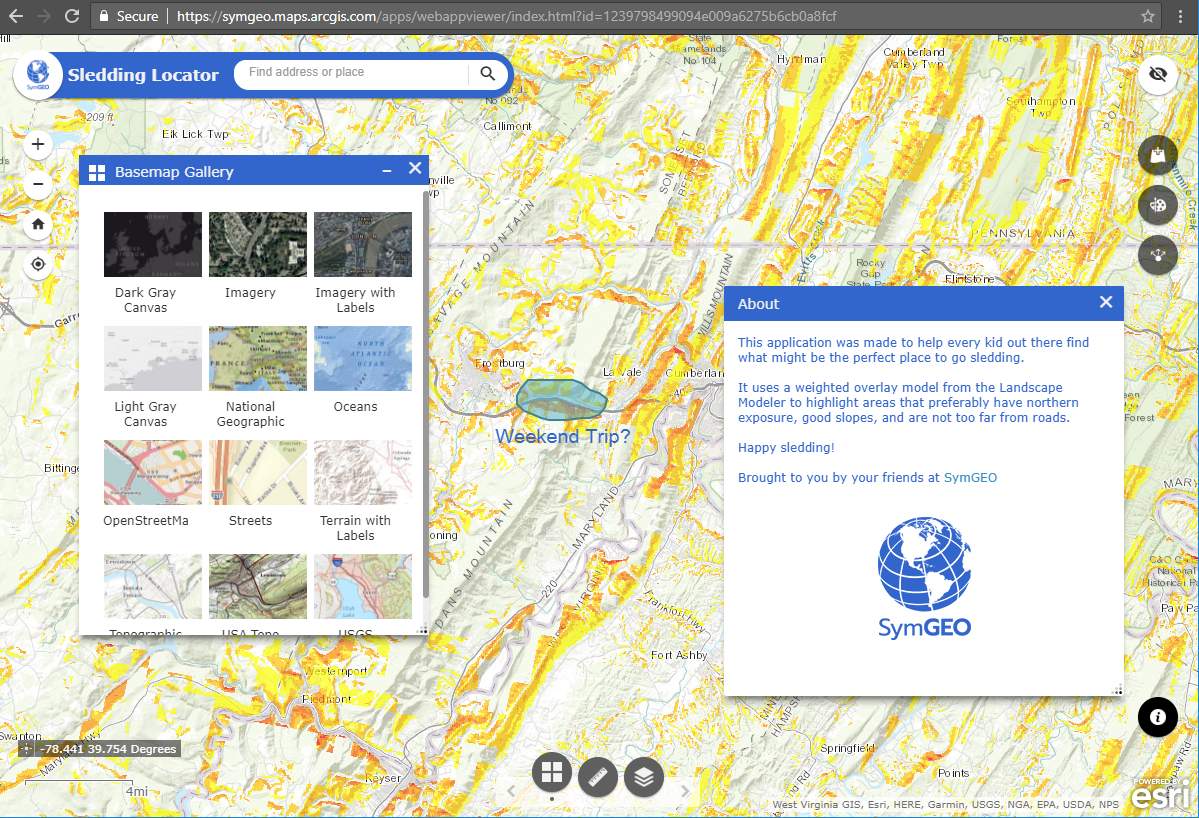
This information was explored in ArcGIS Online and showed the scale and timing of the expected hurricane landfall.

animated hurricane data

Finally, this data was wrapped in a time-aware, mobile responsive template in ArcGIS Online and tested to make sure it was pulling current data.

hurricane tracker phone

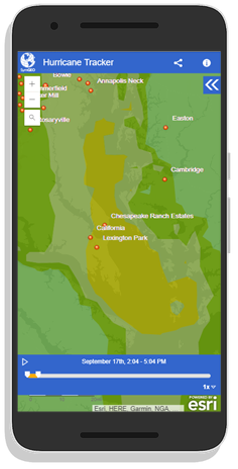
Check out the Hurricane Tracker today and let us know if you have an idea that SymGEO can help you with!

Sledding Locator

Sledding and July don’t usually go together, but what better time to plan out the winter’s adventures? This is the quintessential example of an idea that took 6 months to mature and then a few hours to accomplish, thanks to the power of Web AppBuilder and Landscape Modeler.

Like all great solutions, I was trying to do something else (boring technical details redacted), but happened on the Landscape Modeler which had most of the needed architecture already in place. By wrapping the model into an application configured using Web AppBuilder, the Sledding Locator was created in a matter of hours.

Sledding Locator

This application leverages a weighted raster overlay (WRO) model that specifically targets northern-facing sloped areas with roads in the general vicinity. When combined with some of the other basemap layers, particularly imagery to see if it’s relatively open lands, users will be able to tell if it’s worth scouting out for sledding potential following a snow-storm!

Landscape Modeler

From the technical Esri documentation: Weighted overlay has three conceptual steps. First, each raster layer is assigned a weight, as a percentage, in the analysis. This allows you to emphasize the relative importance of each layer in the analysis. Second, values within each raster layer are mapped to a common suitability scale. This allows you to compare the different types of information in each raster layer. Third, all raster layers in the analysis are overlaid. Each raster cell’s suitability value is multiplied by its layer weight and totaled with the values of other raster cells it overlays. The result is a suitability value that is used for symbology in the output raster layer.

Two input rasters have been reclassified

A number of other handy tools are included in this mobile responsive application so users can add their own data, add map annotations (drawings and text), or share the application with their friends.

Check it out today and let us know if you have an idea that SymGEO can help you with, or send us pictures of awesome hills you’ve found with the app!