I admit, I resisted for years. Workflow automation seemed like too much work to set up, and I always argued that my spatial data challenges were mostly one-off unique situations that weren’t conducive to setting up a workflow. Until one recent day I saw the light… and I blame California.
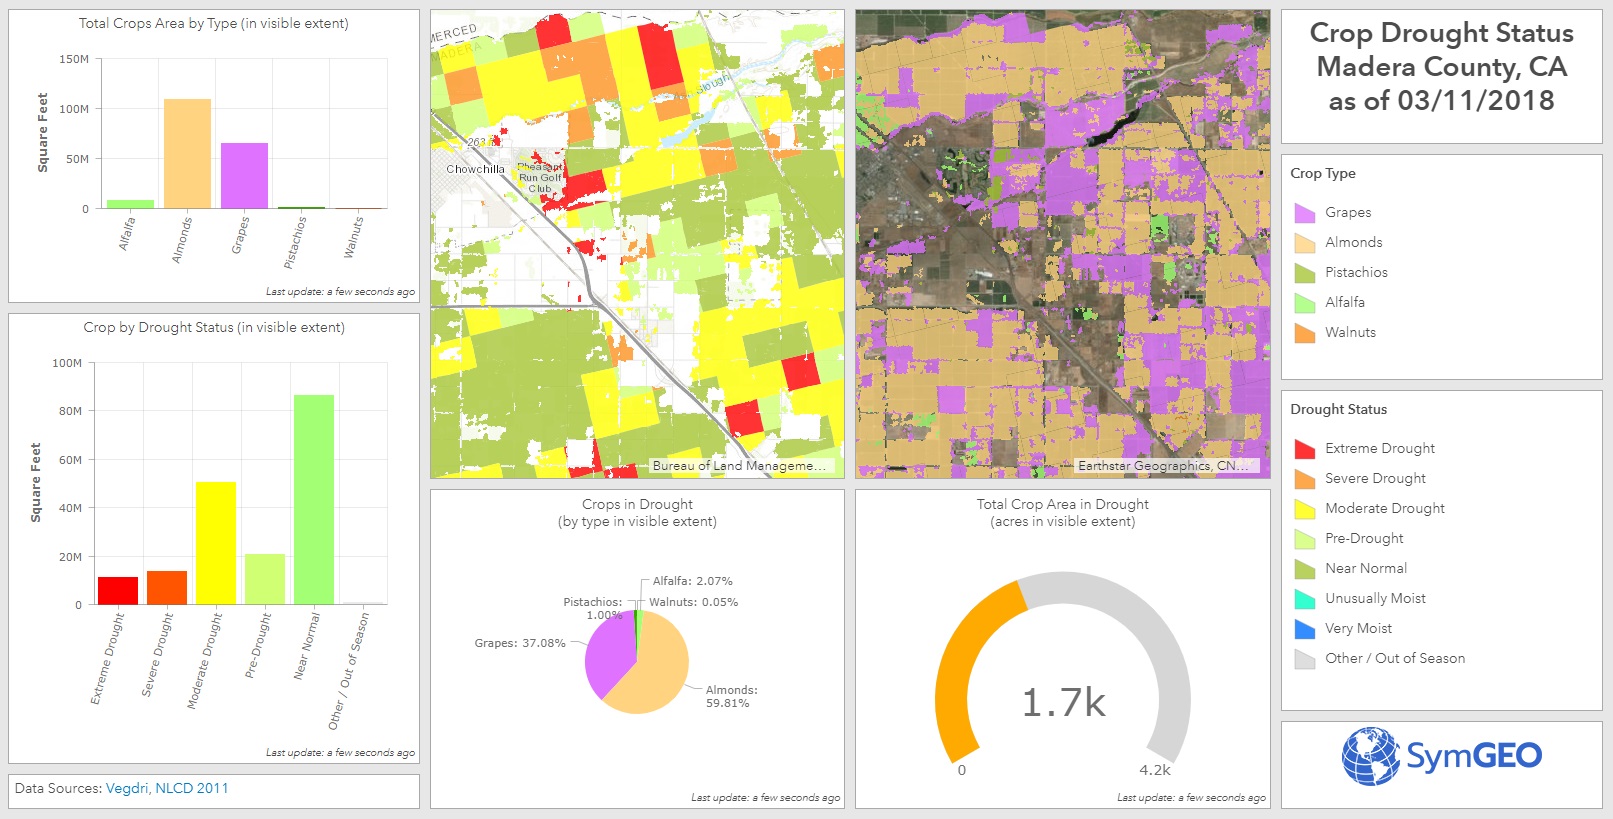
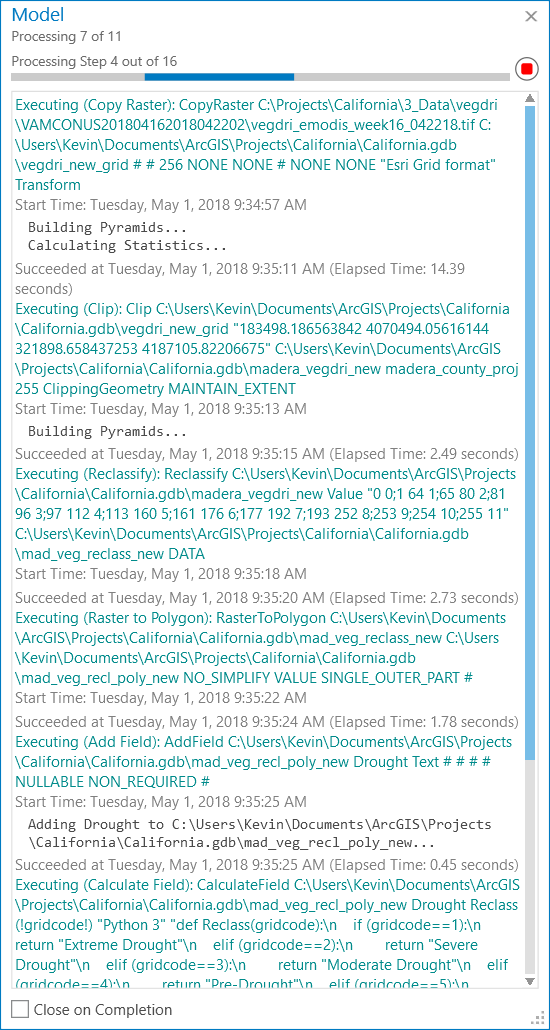
Perhaps you remember our work to incorporate near real-time remote sensing into crop drought monitoring? Well, it turns out that to keep an application like that up to date, the same process is needed time and again, and so the need for data automation was born into the world of SymGEO. Through automation, data layers and attribute fields are always named the same, and features can be over-written without fear of “something breaking” deep within a configurable application. There is also the added benefit of incorporating the usual workarounds that go into regular behind-the-scenes geospatial work such as calculating areas as acreage, or converting grid values into meaningful text. This saves countless hours of frustration and memory searching down the road when trying to repeat a process.
Needless to say, this does cause a model to expand once all the pieces are bolted on, but Esri’s ModelBuilder allows the easy configuration (and re-configuration) of the model until all works as designed.
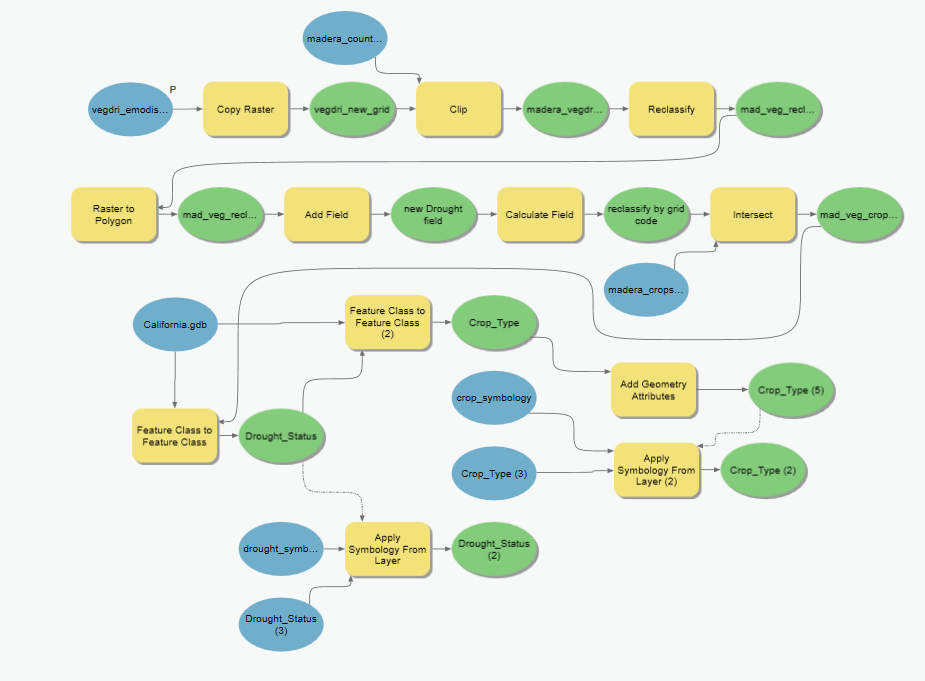
This model has been run many times to make sure all products worked as expected, especially during initial configuration. However, the time savings was considerable with workflow automation given the number of steps involved and the dependency on intermediate layers. In hindsight, it seems to be the finding and configuring of the tools that takes time, not the actual running of the tool.
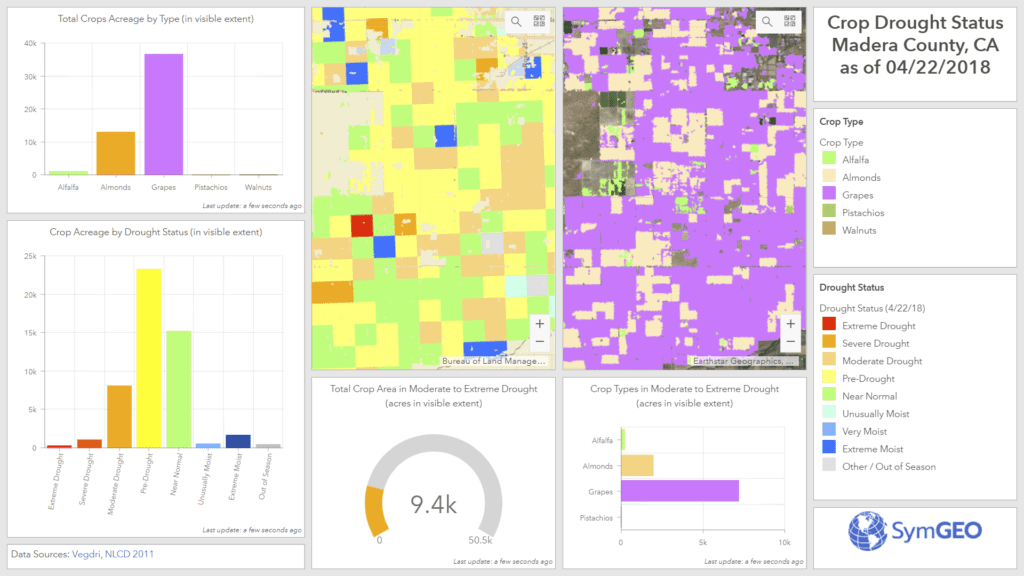
These work products were used to produce and optimize the Crop Drought Status dashboard, which is now ultra-responsive and designed for use at the county-level.
If you’d like a second pair of eyes on your data workflow, let us know, as SymGEO is ready to automate with ModelBuilder!