Flood Impact Visualization

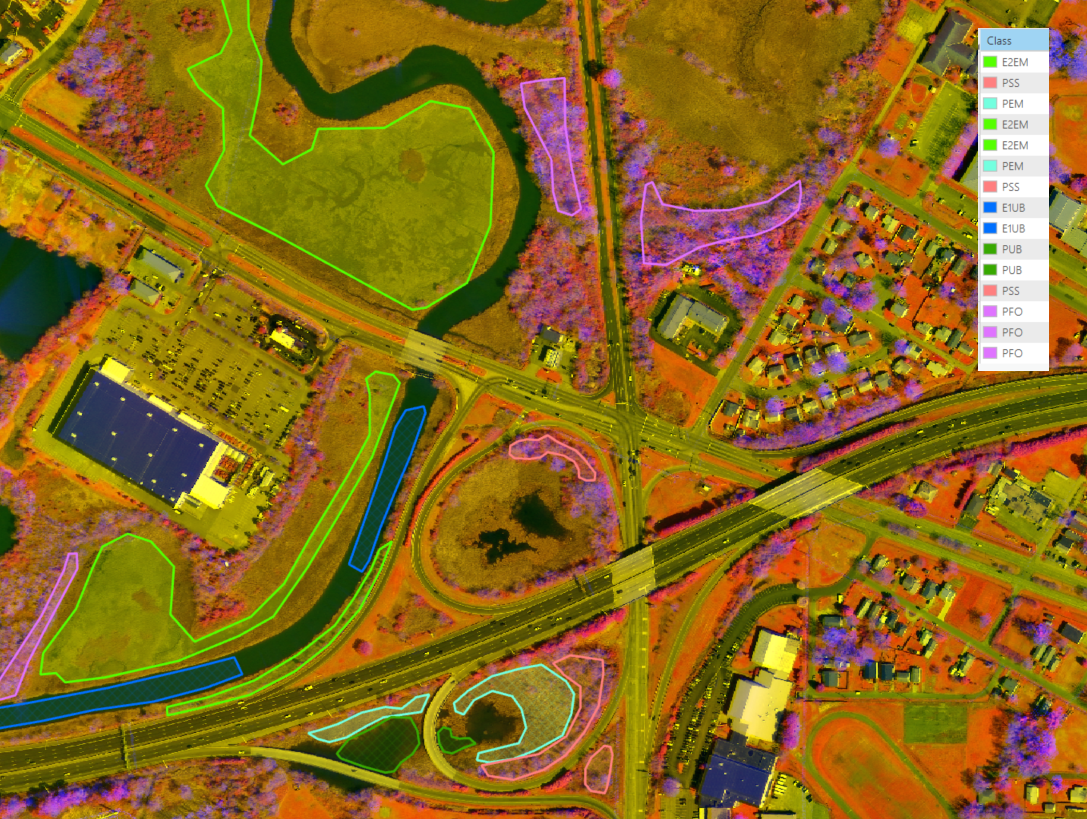
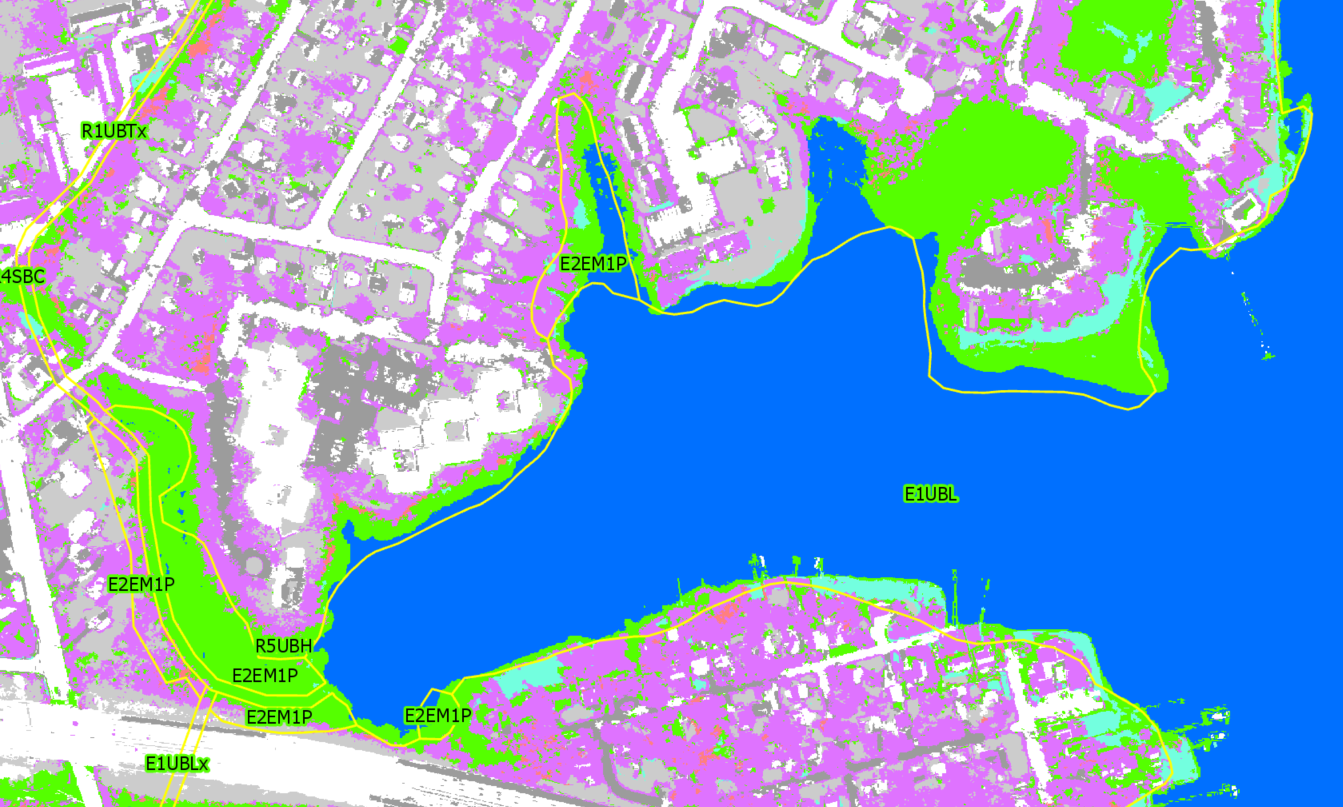
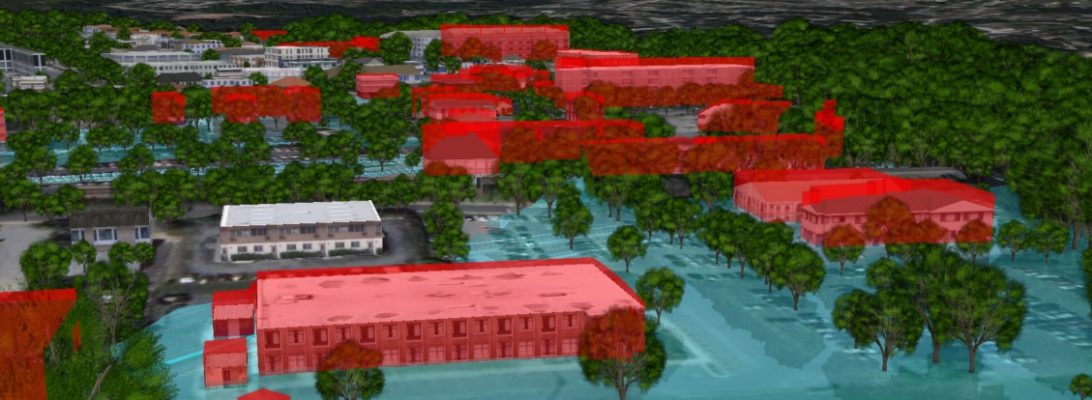
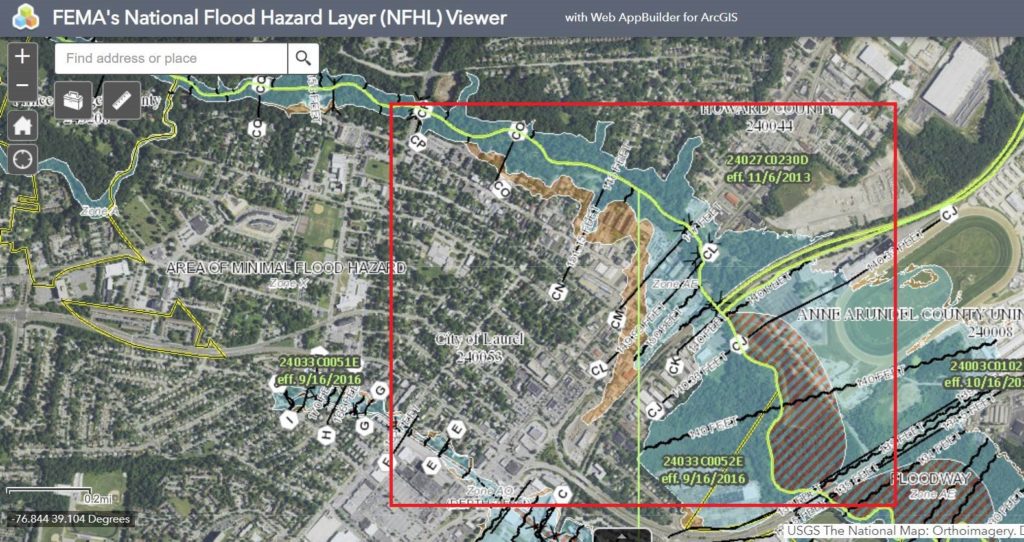
SymGEO is excited to demonstrate flood visualization technology built on the Esri Local Government 3D Basemap Solution.  In this example, the City of Laurel, Maryland, has a number of buildings that are located in the floodplain and are therefore at risk of flooding. This information can be conveyed using the FEMA National Flood Hazard Layer (NFHL) Viewer as shown below, but we decided to bring this data to life using an Esri ArcGIS Solution instead!

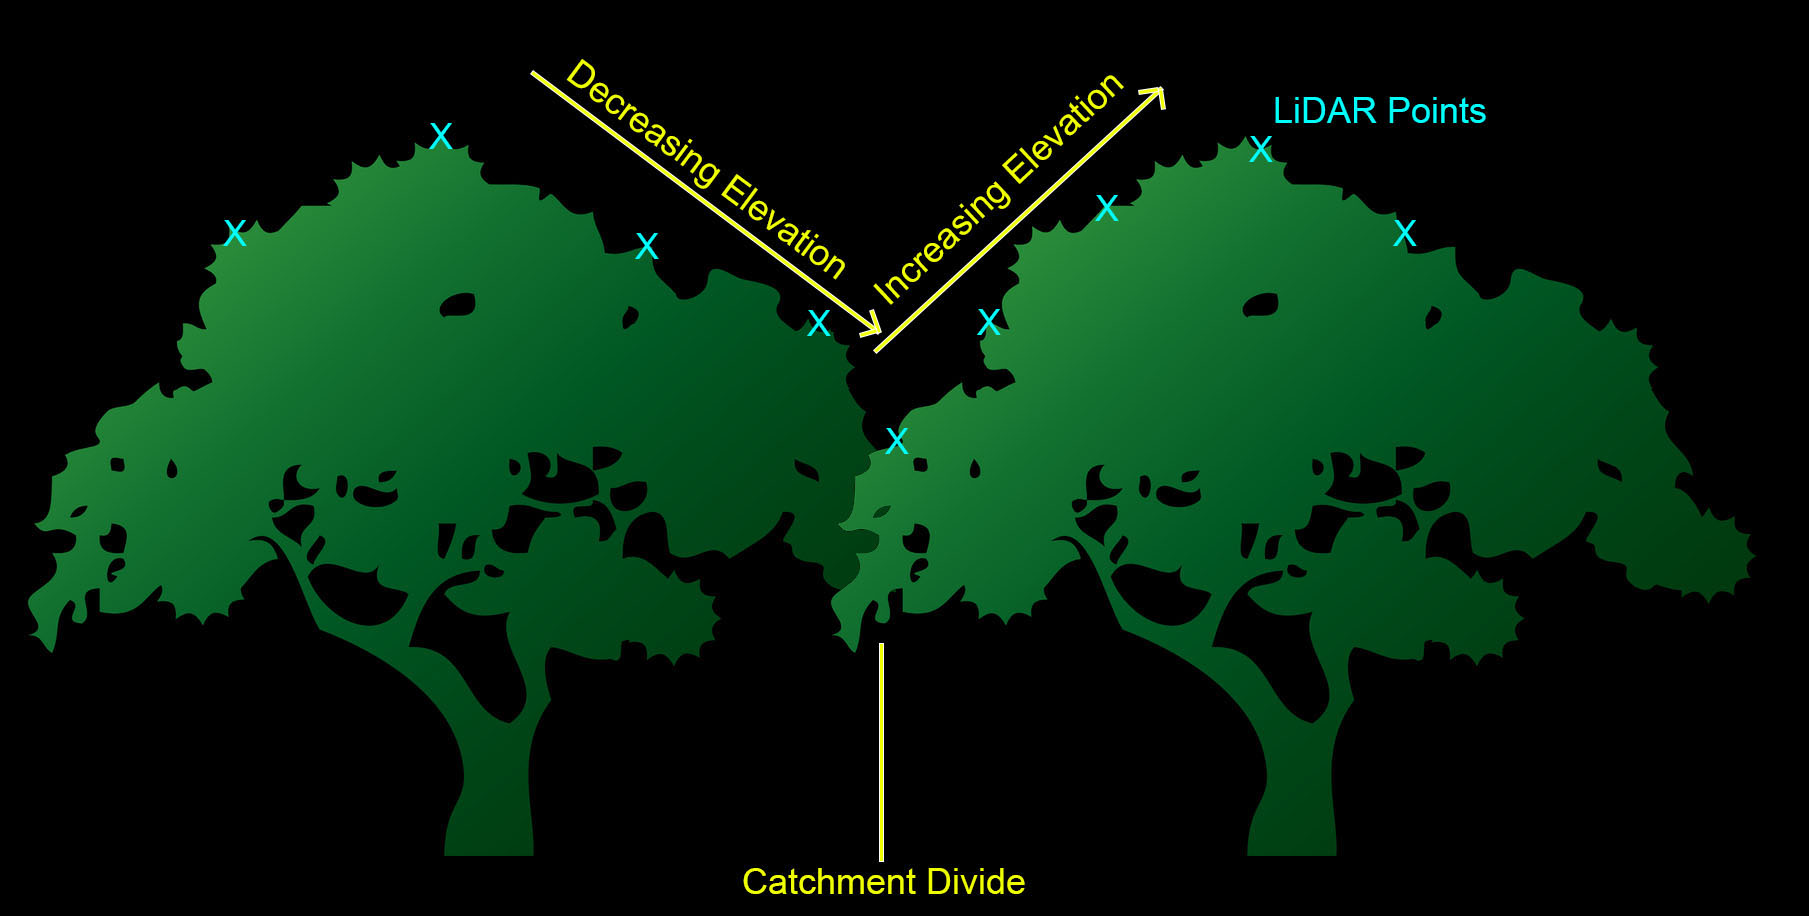
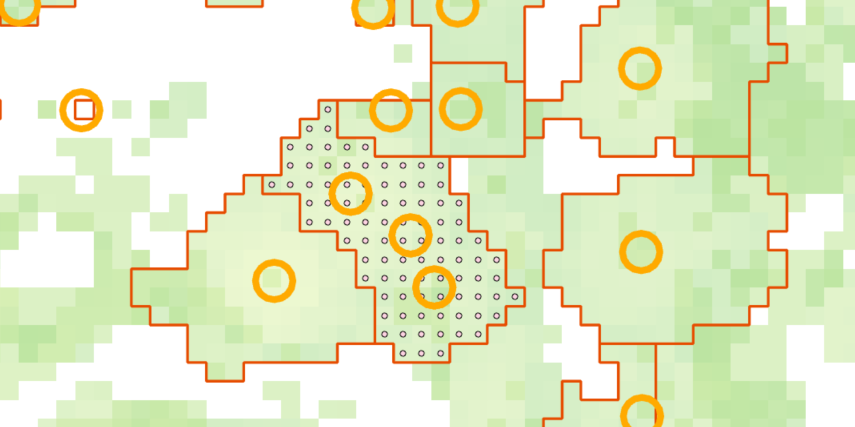
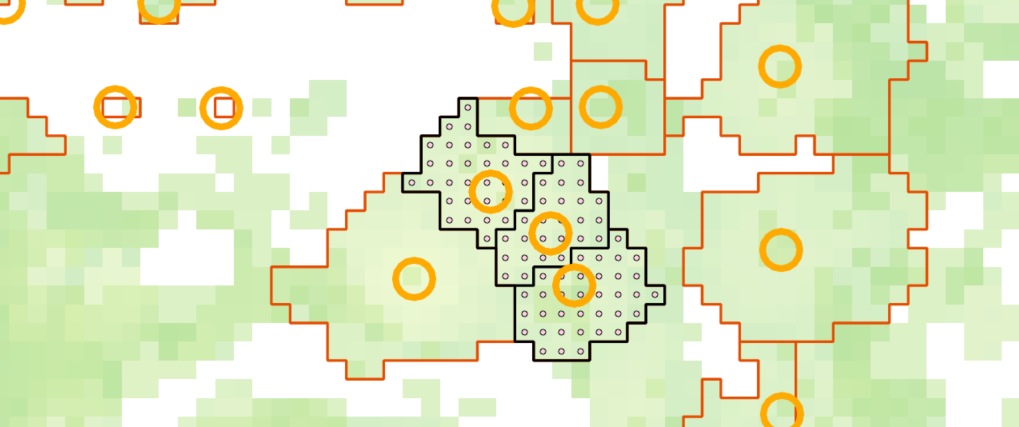
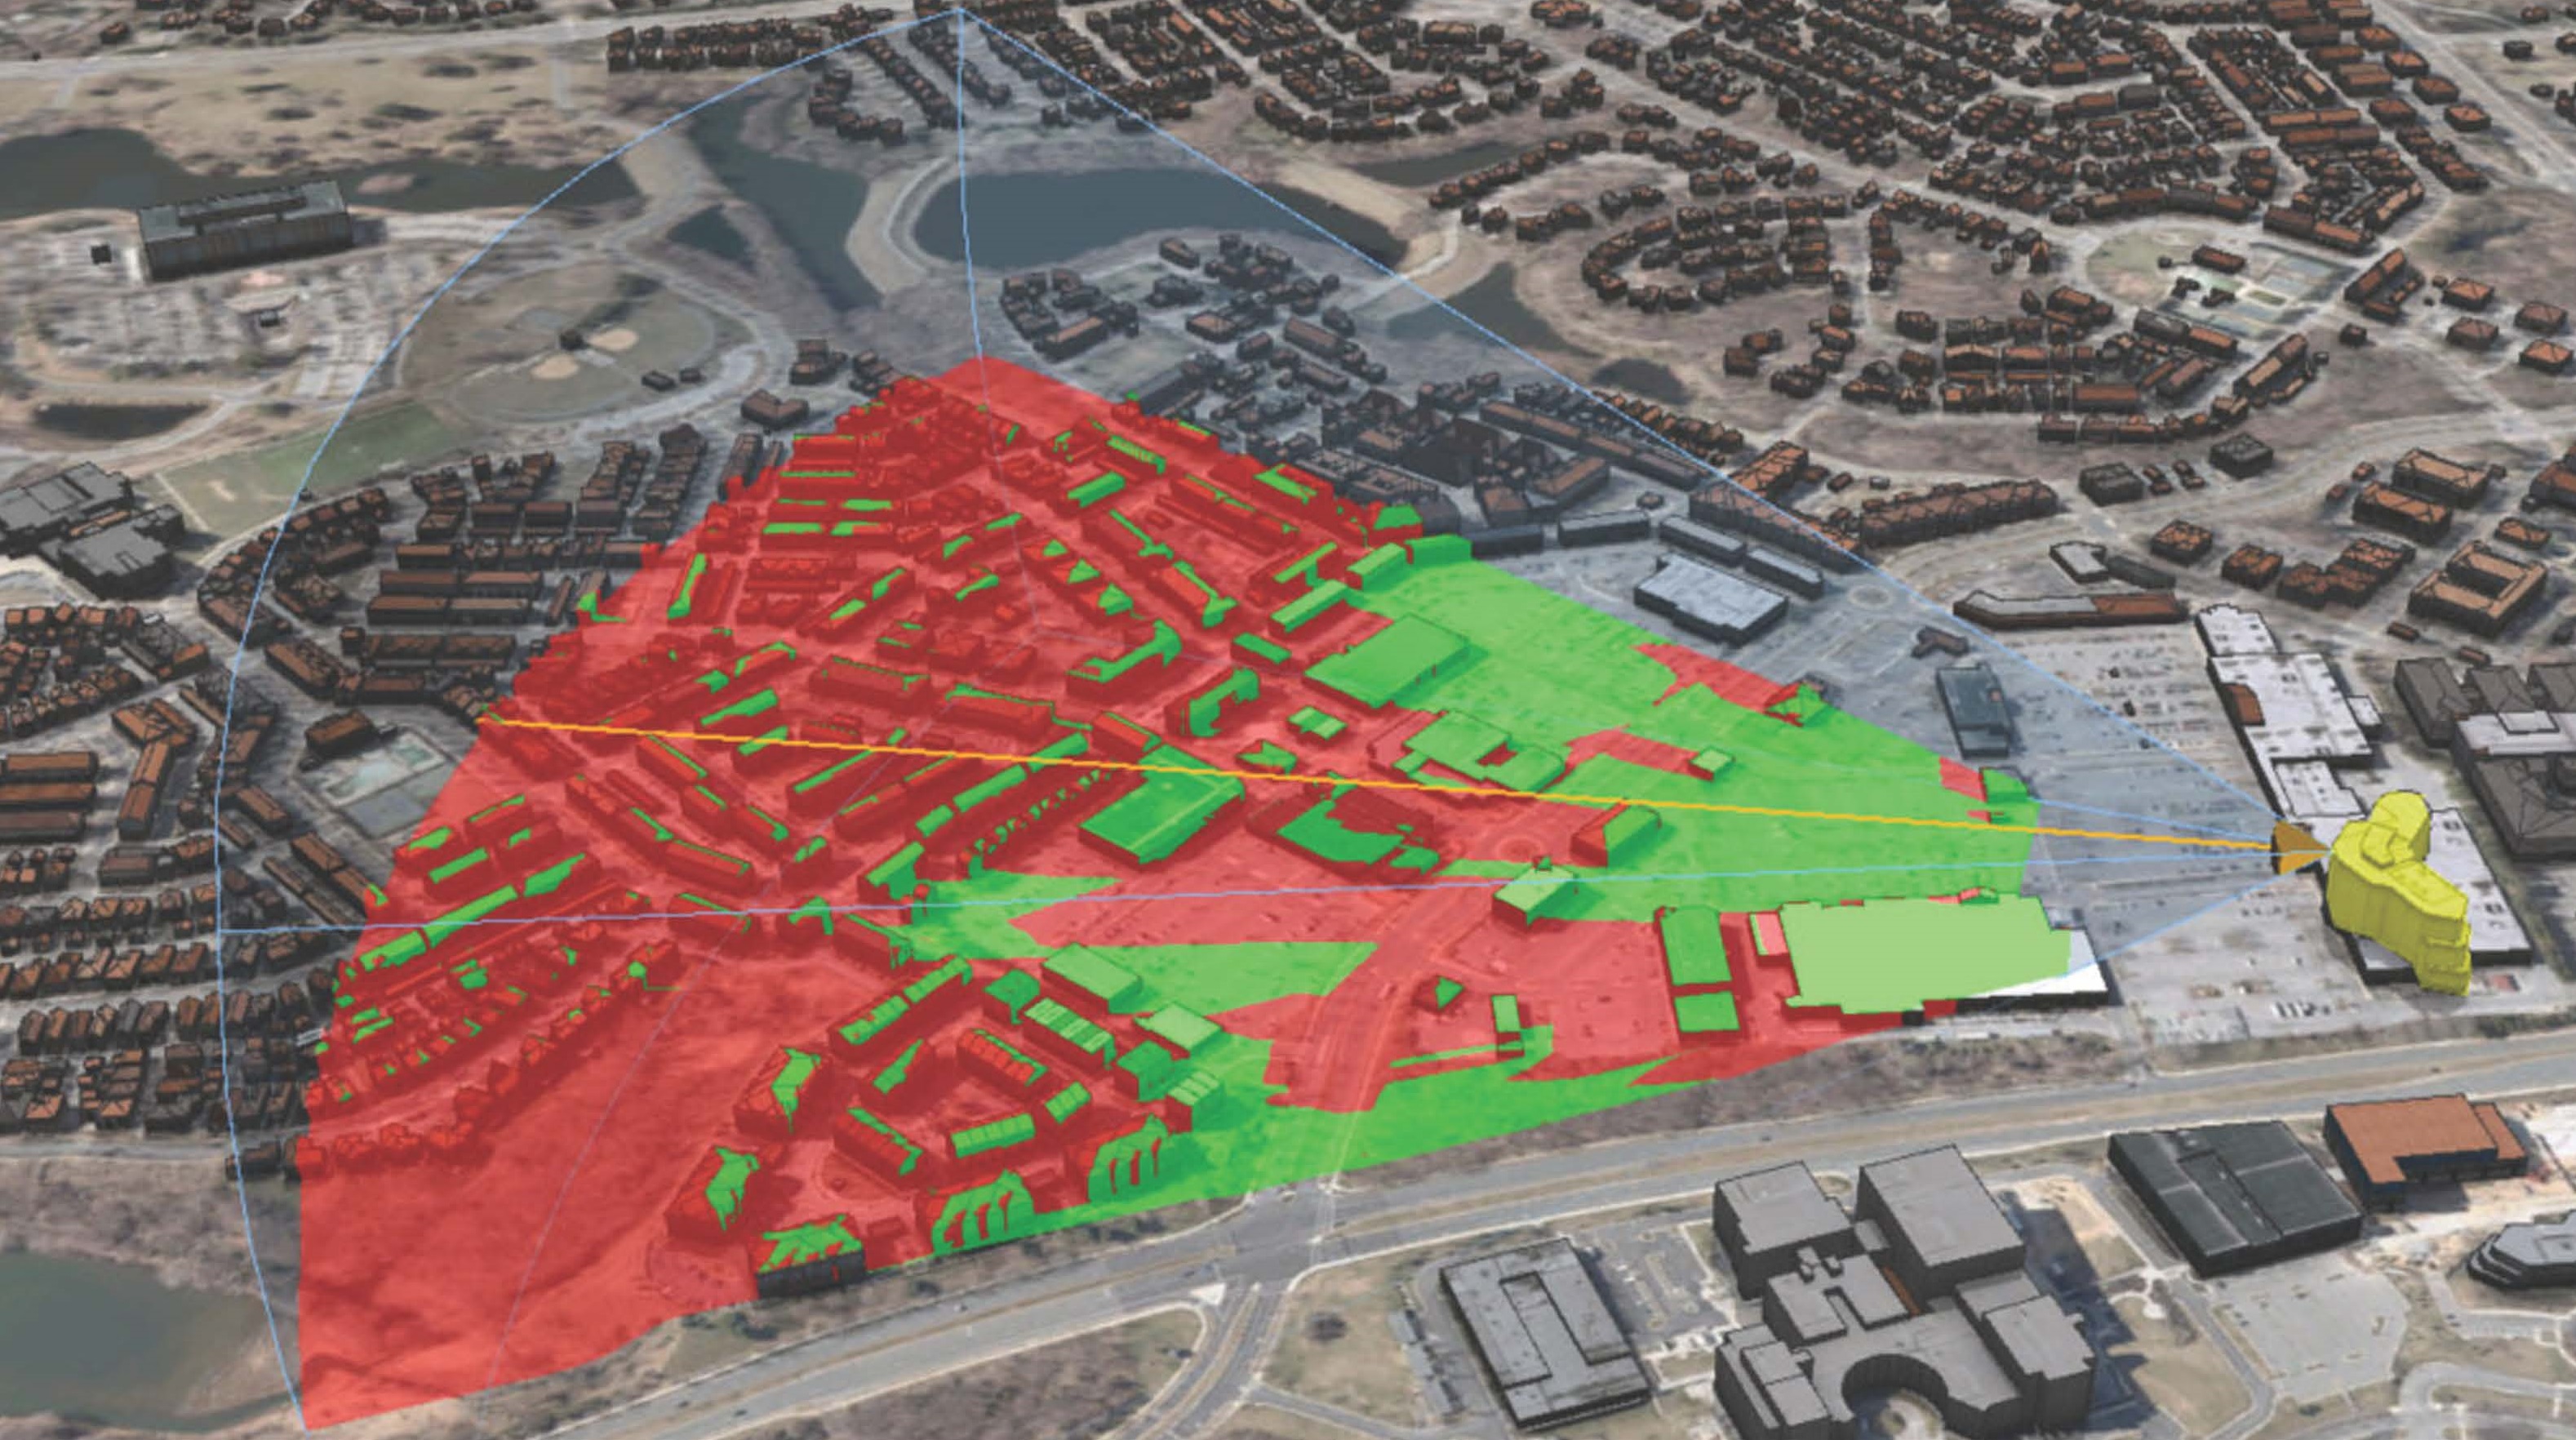
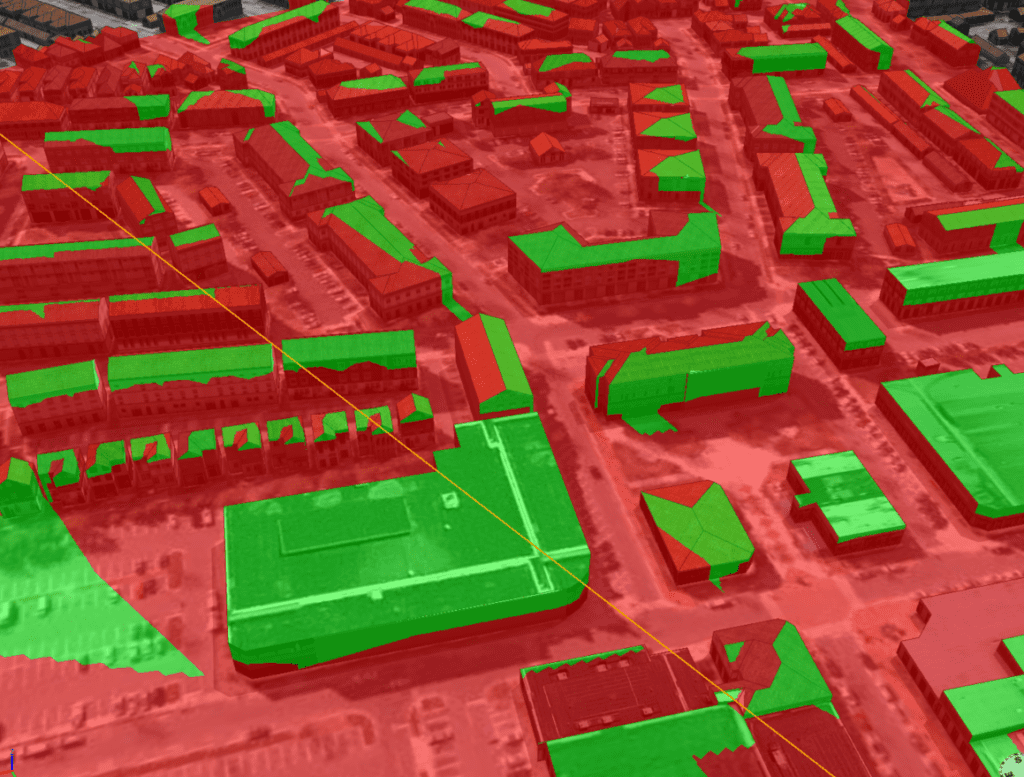
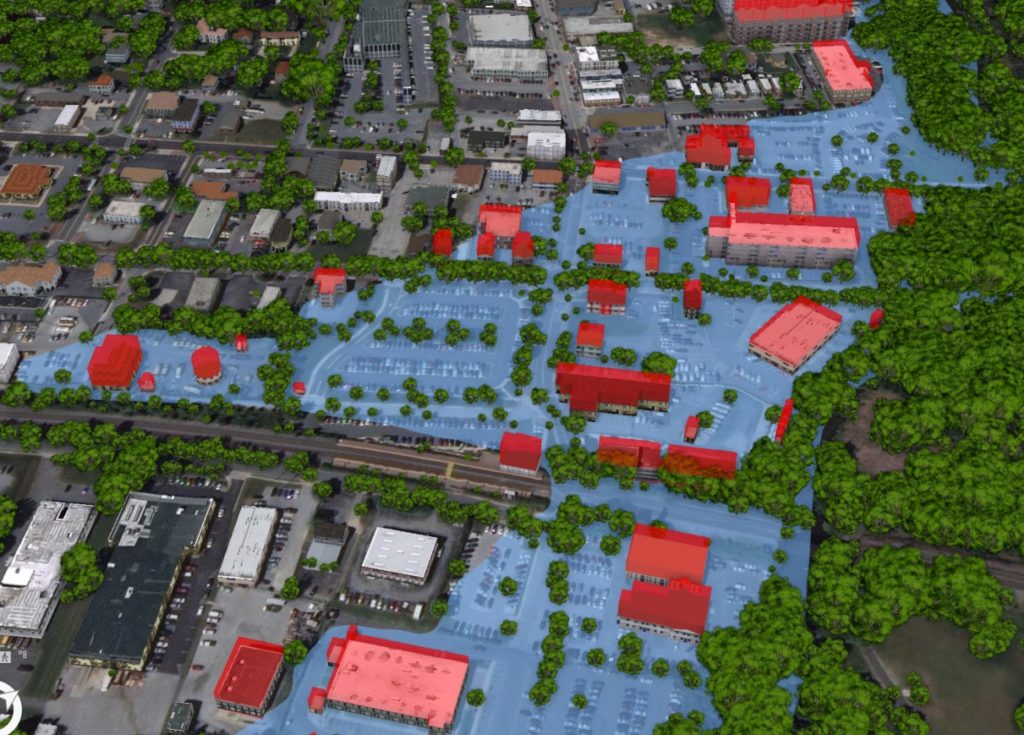
Our journey began with a virtual trip to the Maryland iMap GIS data portal to download the best-available LiDAR data for our area of interest. We then visited the Maryland-National Capital Park and Planning Commission GIS Open Data portal to get building footprint information. Finally, after following the defined steps in the ArcGIS Local Government Solution, we were able to visualize flood impacts in realistic 3D from citywide to local perspectives.

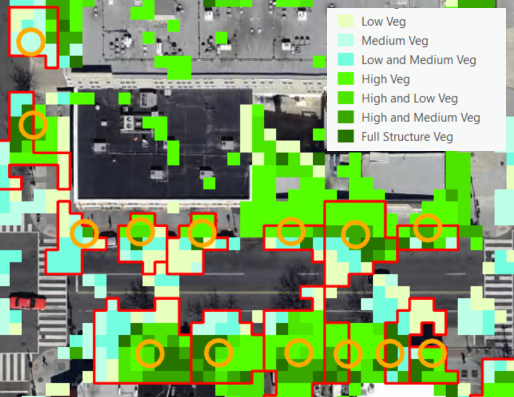
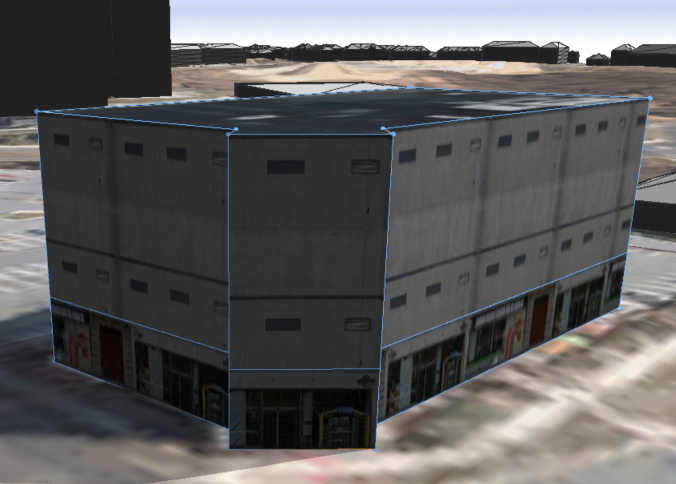
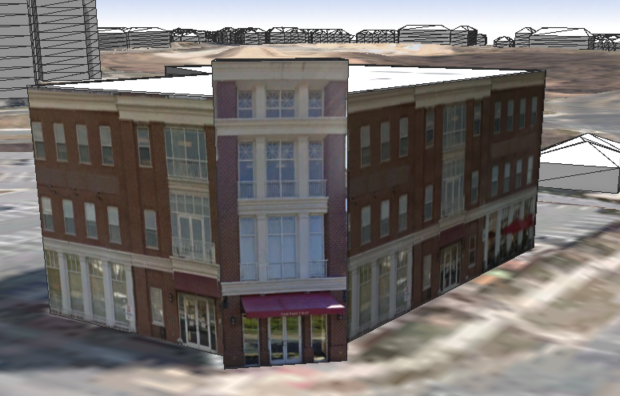
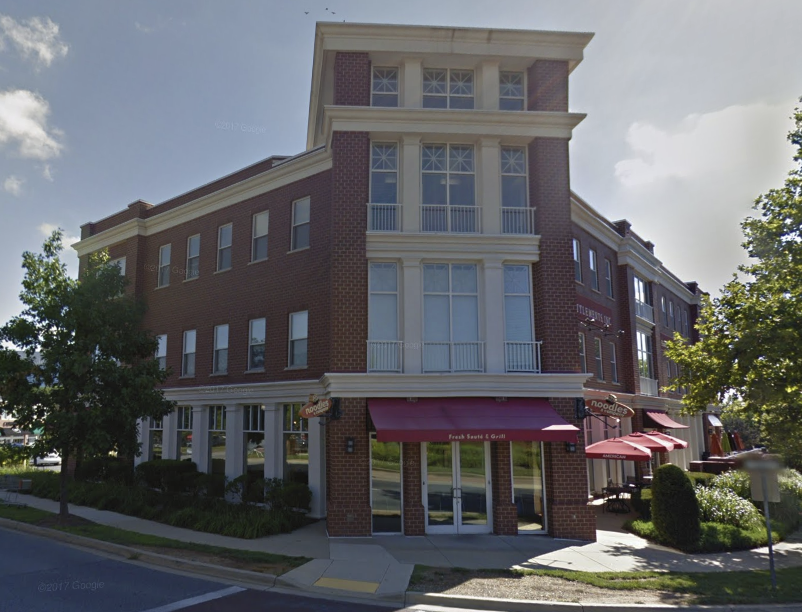
Realistic building textures, vegetation, and current imagery allow the user audience to recognize features and landmarks during demonstrations. Streets can be labeled, and buildings of interest can be highlighted with either labels or colors to call attention to focus areas.

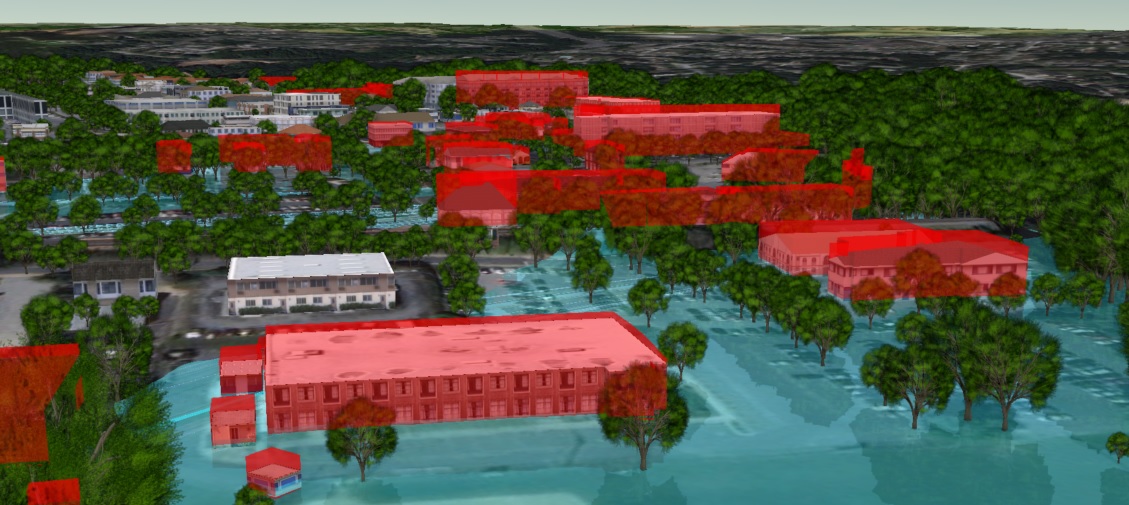
Continual improvements using Esri’s 3D rendering and animation technology enable fly-throughs, call-outs, layer transitions, time-lapse visualizations, and other features and functionality that make this 3D basemap solution the perfect tool to communicate risk and mitigation plans.

Contact SymGEO for your 3D visualization and communication needs and start a conversation today!

Forest Structure Analysis using LiDAR

SymGEO is pleased to announce the development of two new D.C. forest structure datasets created in partnership with DDOT Urban Forest Division, using LiDAR data managed by OCTO and the DC GIS program. The final version of this dataset will help Urban Foresters manage the canopy by providing important attributes including tree height, canopy width, and forest structure information.

A little background: LiDAR data is a digital cloud of millions of elevation points typically gathered by a low-flying airplane or ground-level vehicle. The elevation is recorded at every surface the measuring laser beams hit, so in the case of a forest, it will capture the top of the trees, some branches, as well as under-story vegetation and ground elevation. The LiDAR used for this project was also classified by the provider into a number of useful categories, including buildings, ground, and high / medium / low vegetation.

Using an innovative method, SymGEO used the ArcHydro toolset to create “catchment” areas for each tree, with tree locations being determined by the UFA Street Trees dataset. Each tree point was given an artificially high elevation value, and then all surrounding vegetation points around the tree point were examined. If the model determined that the vegetation points were connected to the tree, then it was included in the catchment. If an adjacent tree was found (indicated by adjacent vegetation elevation points increasing in height), then the catchment was divided into the two tree areas. Kind of technical, but maybe the graphic below will help 🙂

This catchment method worked quite well; however, it did suffer from capturing multiple trees in the same catchment. Fortunately, these cases were isolated quite easily be doing a spatial join between the catchment areas and street tree points, and identifying many-to-one joins.

For these cases, the catchment areas were converted into a grid of points, and the points were joined to the nearest tree. They were then back into areas (with the new tree ID as an attribute), effectively splitting up the area into smaller areas that had a one-to-one join with the tree points.

Once the tree area was established and cleaned up through manual inspection of outliers, attributes including tree height and average canopy width are assigned to each tree. These attributes will help the Urban Forestry Division manage the tree canopy even more effectively.

A secondary dataset was also produced using the LiDAR data that categorized areas into high, medium, or low vegetation, so some combination thereof. This helps the Urban Forestry Division prioritize areas for under-story plantings or the establishment of new urban canopies. This data set suffered a little from miscategorized LiDAR points, but it is a good starting point for an urban canopy structure dataset.

If you have access to a LiDAR dataset, and are interested in learning more about derivative products, contact us today – SymGEO is here to help!

Remote Sensing of Wetlands

SymGEO is proud to announce a new project with the Virginia Department of Transportation (VDOT), designed to explore the use of remote sensing techniques in the identification of wetlands. Traditional wetland delineation requires expert field work, which includes many hours of travel, sampling, and precise survey measurement to delineate what can actually be quite a variable environmental boundary. The best indicators of wetlands tend to be the vegetative species, ground elevation, and hydrology connectivity. Soil sampling and other methods are used to further validate findings, but in today’s data-rich environment, a pretty good indication of wetlands can be gathered through remote sensing.

For this project, LiDAR elevation information was combined with multi-spectral imagery to produce a 6-band composite image using ArcGIS Pro. This composite image was then used in conjunction with National Wetland Inventory (NWI) data to establish training sites for a supervised classification algorithm.

Once a suitable number of training sites were established, the supervised classification algorithm was run on the pilot study area. The results were compared with the National Wetland Inventory data, and a substantial improvement in boundary alignment was noted. This is critical in the accurate measurement of potential impacts to wetlands during road construction or property development, so that an equivalent, mitigating wetland area can be created elsewhere.

It was noted that upland forested areas were sometimes identified as wetland forested areas, indicating that elevation relative to nearest water needs to be included in the classification algorithm. The classification results are currently used as a guide for semi-automated wetland area delineation, but we believe the model could mature to include all required factors and accurately, automatically delineate the wetlands.

If you have supporting data and a need for efficient wetland delineation, SymGEO would love to talk!

Building Imagery and Simulation

There are times when generic building models need to be upgraded to give a better representation of what is actually there. This may be useful for “hero” buildings that are immediately identifiable, or perhaps an area that has planned redevelopment activities taking place. Fortunately, adding custom texture in Esri’s CityEngine is a relatively straight-forward process. In the following example, a building is generated from LiDAR, slightly modified for a complex roof, and then ground photography is mapped as a texture onto the building. Before and after textures are shown below, with the actual building shown in Google Streetview for comparison.

generic building

textured building

google streetview

Another method of adding realism to a presentation is to use the Google Earth platform to capitalize on all of Google’s ground-based LiDAR information and photo mapping (where available). When combined with new building models and a little Photoshop, compelling before-and-after scenarios can be explored in a very cost-effective manner. This example shows where a Kmart complex may be replaced by a high-density residential building.

before-and-after simulation

Viewsheds and site-lines can also be calculated in GIS, as all building models are constructed from either highly accurate geolocated LiDAR information or detailed architectural specifications. This helps pinpoint which existing structures may have their views impacted (shown in green), and so may required additional targeted public outreach before construction begins.

impacted views

Are you planning a new development, want to explore digital 3D data, or need to have your own virtual world built? Let us know, SymGEO is here to help!