🌿 Turning Tree Data into Environmental Insight
Trees are one of the most powerful natural systems shaping our daily environment. They cool neighborhoods, improve air quality, reduce stormwater runoff, and create healthier, more livable communities.
In Kentlands, a partial detailed tree inventory now exists, capturing information such as species, size, condition, and canopy structure. This inventory was funded by the Kentlands Citizens Assembly and conducted by Bartlett Tree Experts as part of a broader effort to understand and manage the community’s urban forest.
While this dataset provided an excellent foundation, it originally existed as a field inventory – rich in detail, but not yet connected to broader environmental insights or public exploration tools.
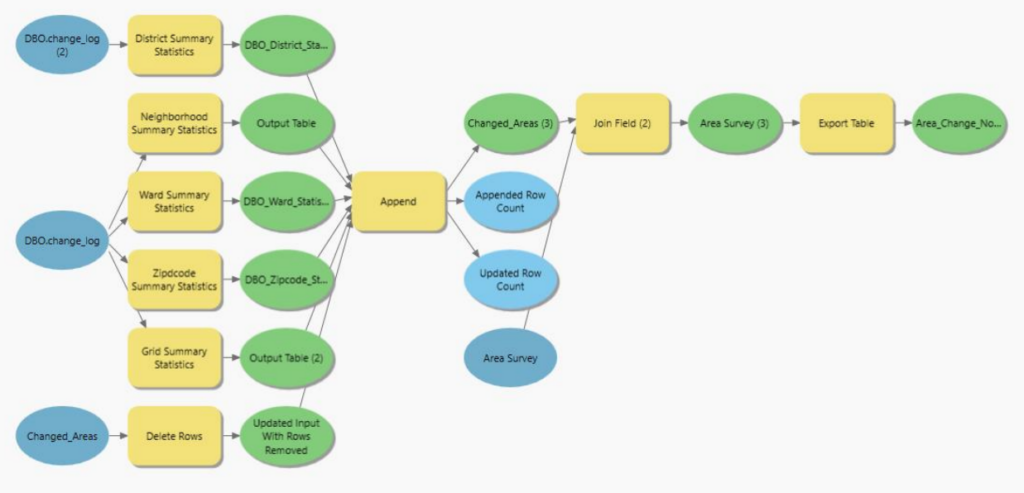
This project builds upon that foundation, transforming the inventory into a spatially enabled system and extending it through environmental modeling and interactive visualization.
🌳 From Tree Inventory to Environmental Intelligence
Once the tree dataset was structured and mapped, each tree was processed through i-Tree Eco, a widely used urban forestry modeling framework that estimates the environmental benefits provided by individual trees.
This step transforms tree measurements into meaningful ecological and economic indicators – helping translate physical characteristics into real-world environmental impact.
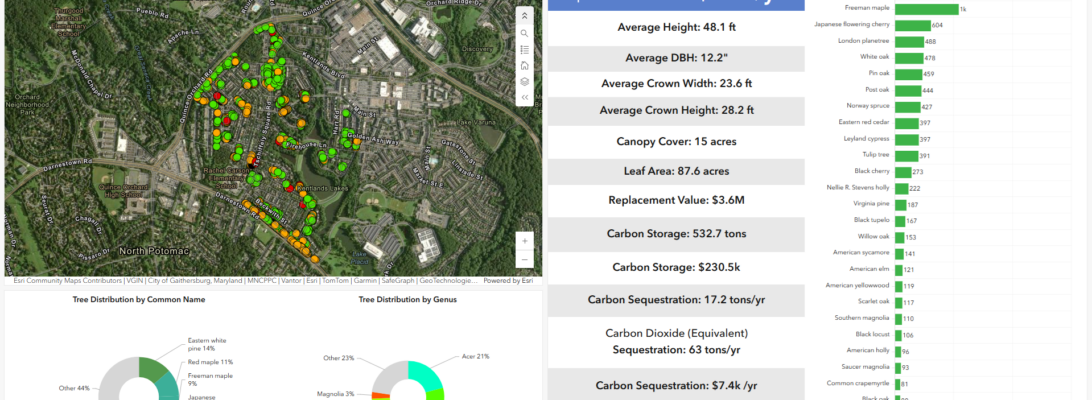
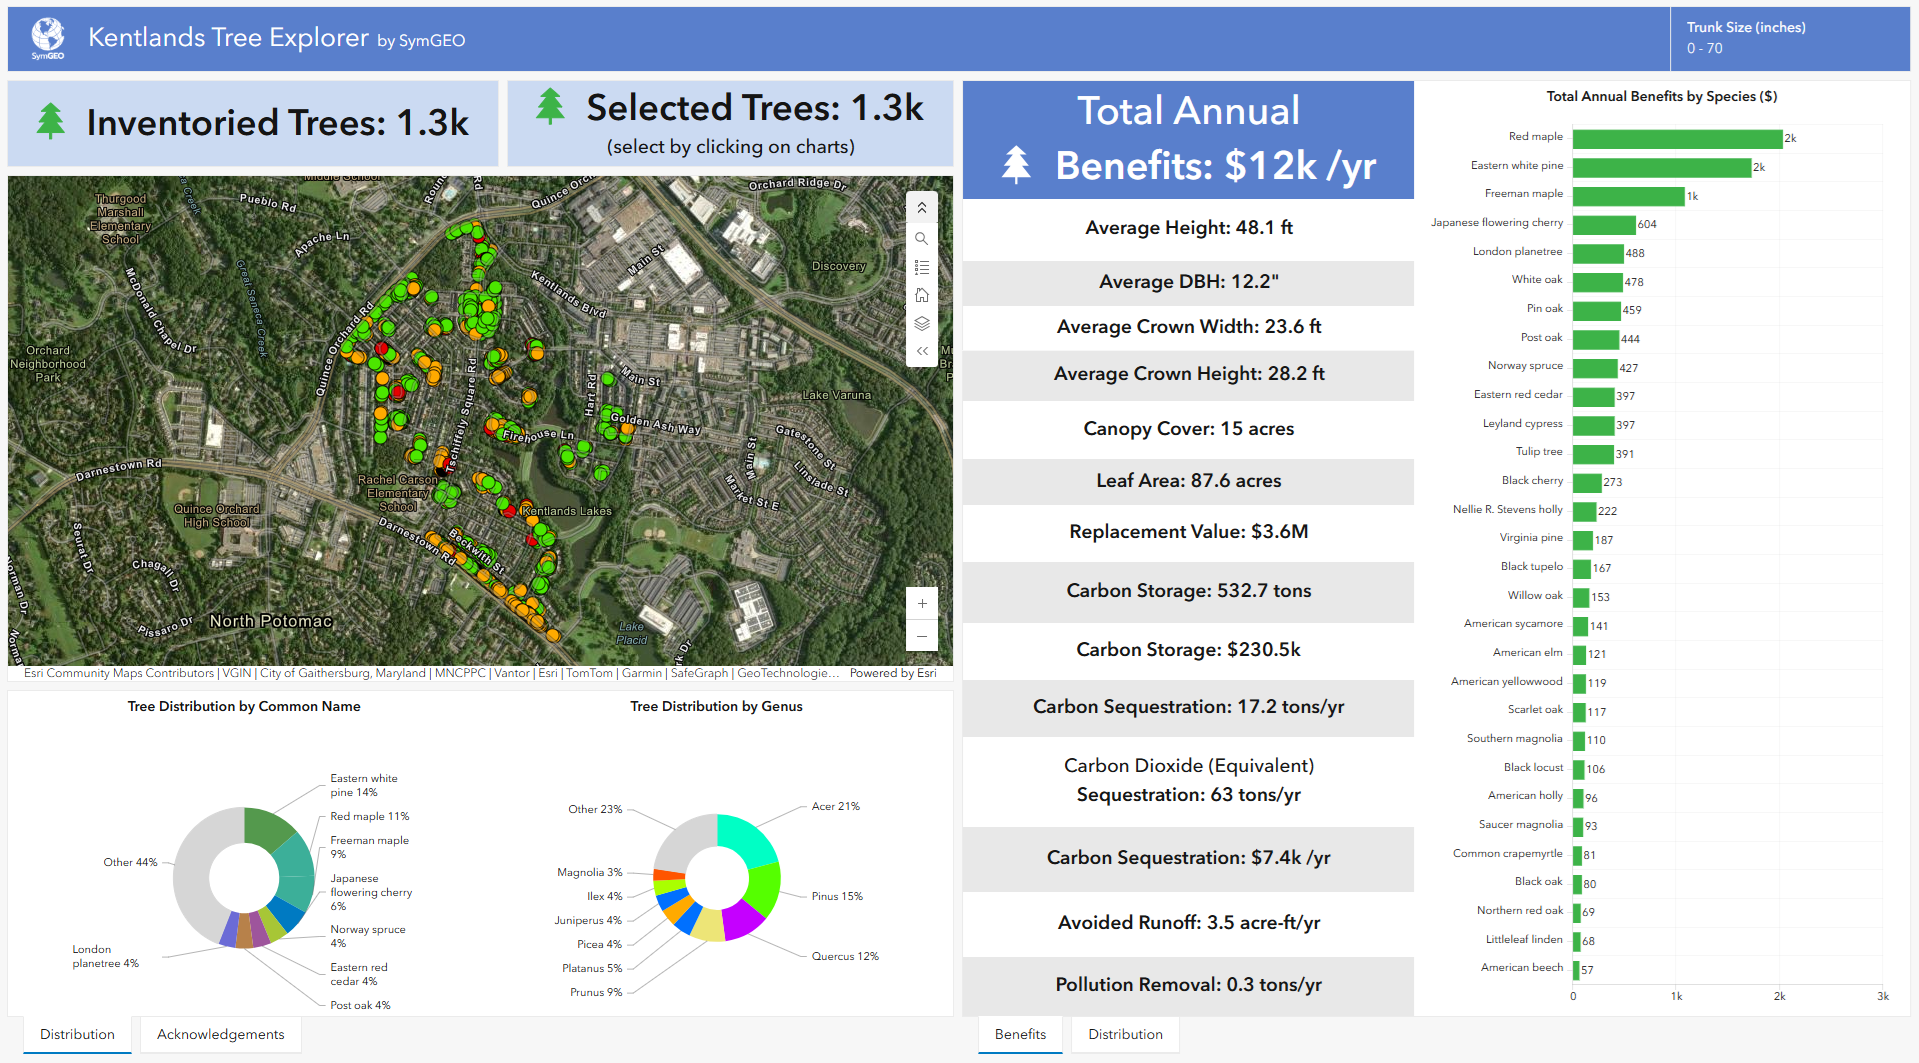
Across the inventoried Kentlands urban forest, the analysis revealed:
- Average tree height: 48.1 ft
- Average trunk diameter (DBH): 12.2 in
- Average crown width: 23.6 ft
- Average crown height: 28.2 ft
These structural characteristics form the basis for understanding the scale and maturity of the urban forest.
🌿 The Environmental Value of Kentlands’ Trees
The i-Tree Eco analysis quantifies the cumulative benefits provided by the urban forest, helping make its value visible in both environmental and economic terms.
🌳 Carbon & Climate Benefits
- Carbon storage: 532.7 tons
- Carbon storage value: $230.5K
- Carbon sequestration: 17.2 tons/year
- CO₂ equivalent sequestration: 63 tons/year
- Annual carbon benefit value: $7.4K/year
💧 Stormwater & Water Management
- Avoided runoff: 3.5 acre-feet/year
🌫️ Air Quality & Pollution Removal
- Pollution removal: 0.3 tons/year
🌿 Overall Annual Ecosystem Benefits
- Total annual benefits: ~$12K/year
🌳 Urban Forest Structure & Value
- Canopy cover: 15 acres
- Leaf area: 87.6 acres
- Replacement value: $3.6M
These figures help translate the physical presence of trees into measurable environmental services – demonstrating their role as critical green infrastructure within the community.
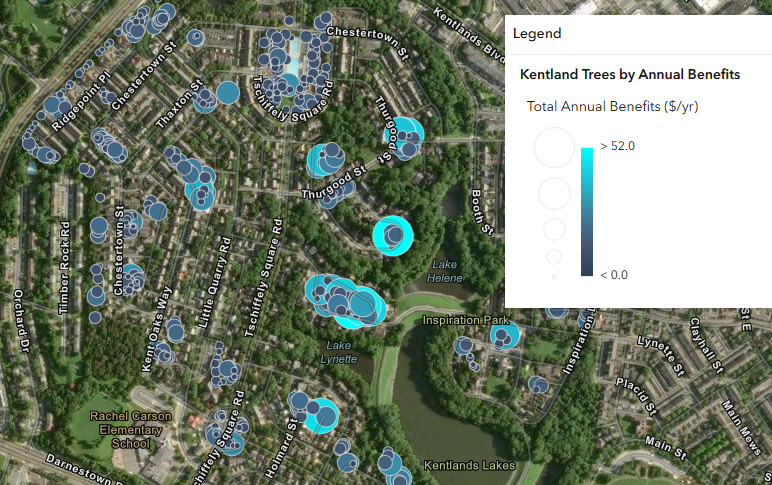
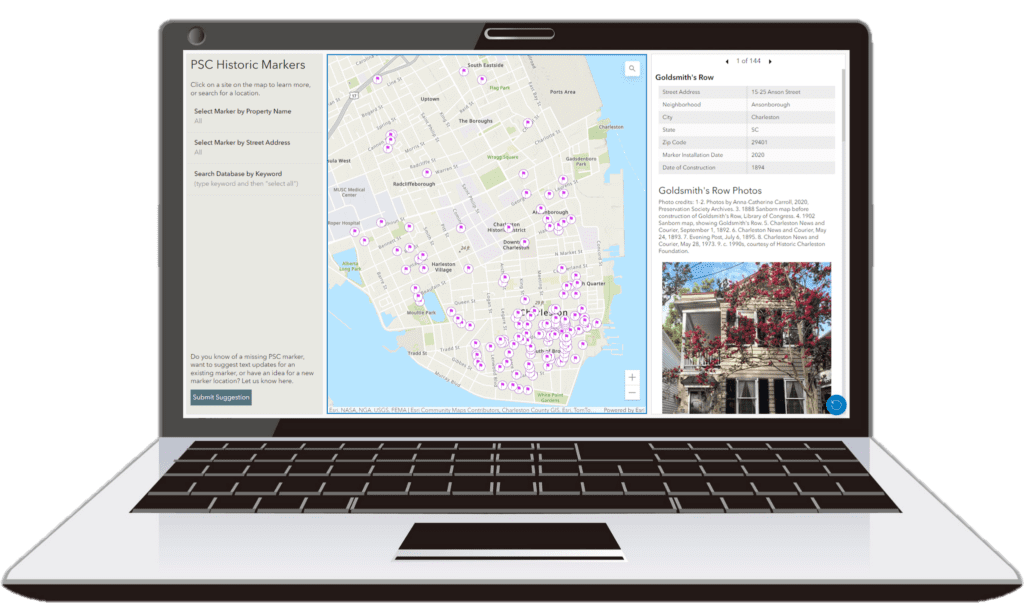
🗺️ A Public Urban Forest Dashboard
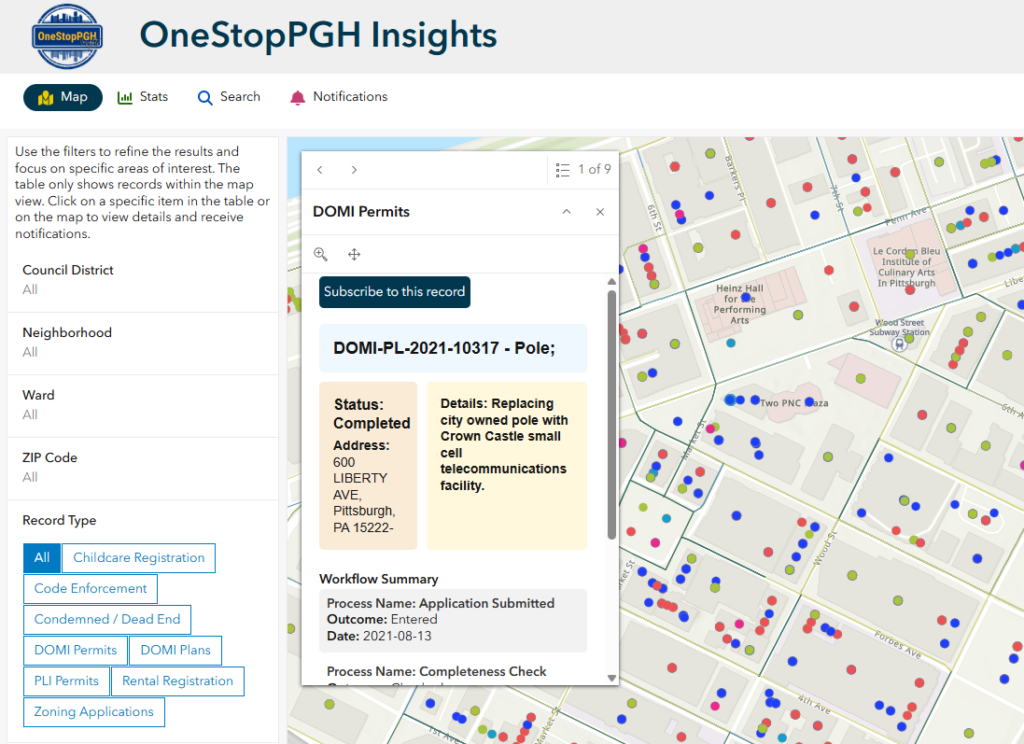
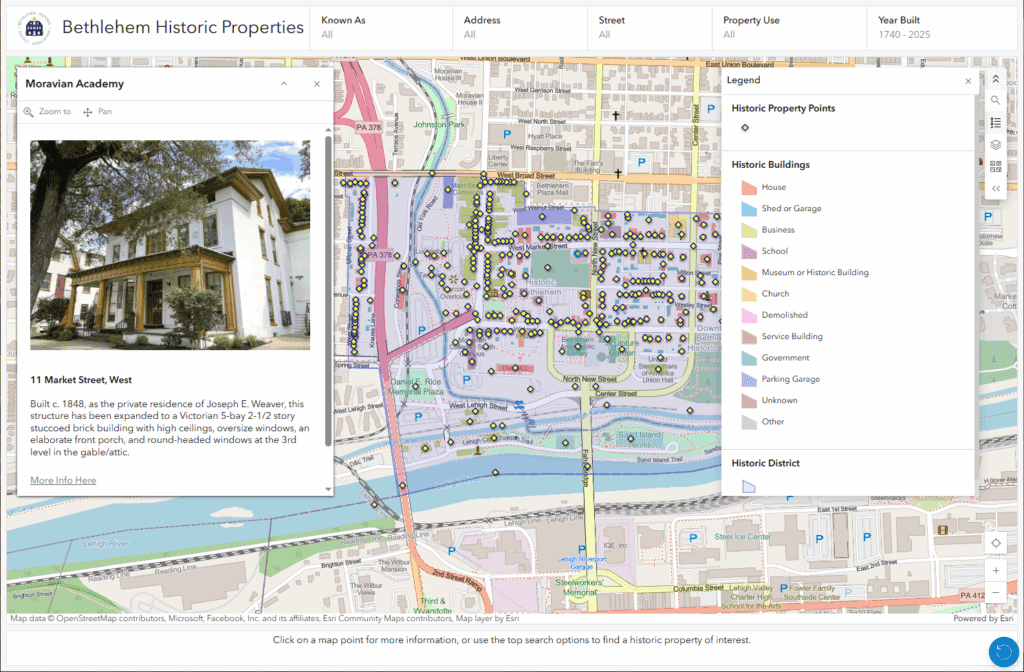
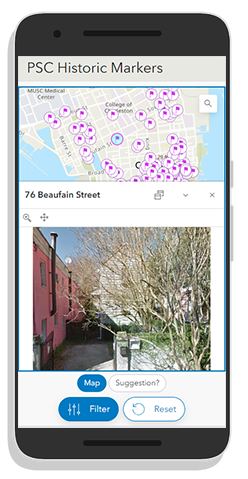
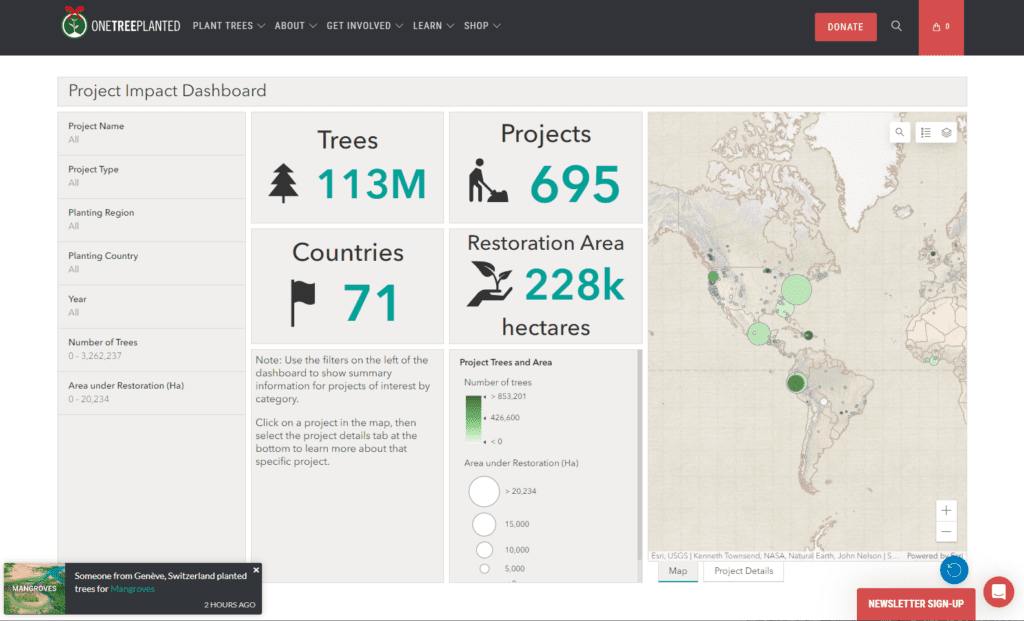
To make these insights accessible beyond technical analysis, the results have been published through an interactive Kentlands Urban Forest Dashboard using ArcGIS Dashboards technology.
This public-facing tool allows residents, planners, and community stakeholders to explore the urban forest through multiple lenses, including:
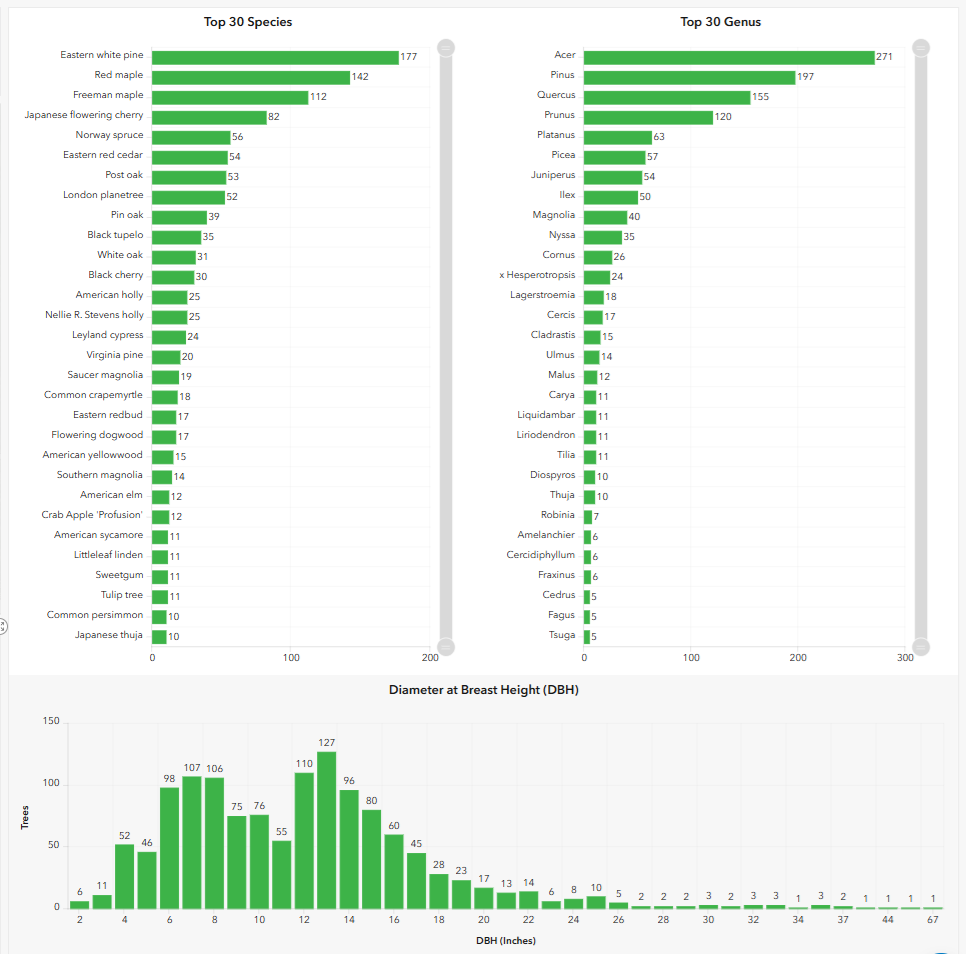
- 🌳 Tree size (trunk diameter and structure)
- 🌿 Environmental benefits per tree and across the community
- 💧 Flood and stormwater mitigation contributions
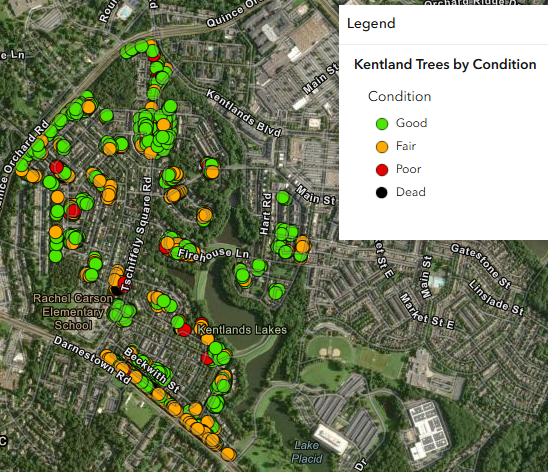
- 🌱 Tree condition and health distribution
Rather than viewing trees as isolated records, the dashboard presents them as a connected environmental system – where each tree contributes to measurable community-wide benefits.
Users can explore patterns across space, compare neighborhoods, and better understand how the urban forest supports resilience and quality of life.
🌍 Why This Matters
Urban forests are often experienced visually but not fully understood in terms of their environmental value. By combining field inventory data, spatial mapping, and ecological modeling, this project helps bridge that gap.
The Kentlands Urban Forest Dashboard enables:
- Transparent access to environmental data
- Better understanding of ecosystem services at the neighborhood scale
- Evidence-based planning for tree planting and maintenance
- Greater public awareness of the benefits trees provide every day
Most importantly, it helps shift trees from being seen as individual landscape features to being recognized as a connected, living infrastructure system.
🌿 Data & Project Acknowledgements
This work builds upon a comprehensive tree inventory funded by the Kentlands Citizens Assembly and conducted by Bartlett Tree Experts.
SymGEO’s role focused on transforming this field-collected inventory into a spatially enabled dataset and extending it through environmental modeling using i-Tree Eco. The result is a public-facing dashboard that allows the community to explore, understand, and value their urban forest in new ways.
We acknowledge and appreciate the collaboration of these partners in supporting data-driven stewardship of Kentlands’ tree canopy.
🌳 Looking Ahead
This project represents a step toward more transparent and data-driven urban forestry management.
As the dataset continues to evolve, it will support deeper analysis, expanded environmental modeling, and new opportunities for public engagement through GIS-based tools.
SymGEO’s goal remains simple: to make the value of trees visible, measurable, and meaningful – so communities can better understand and protect the natural systems that sustain them. Contact us if you have an environmental project that could use some SymGEO love.