Forest Structure Analysis using LiDAR

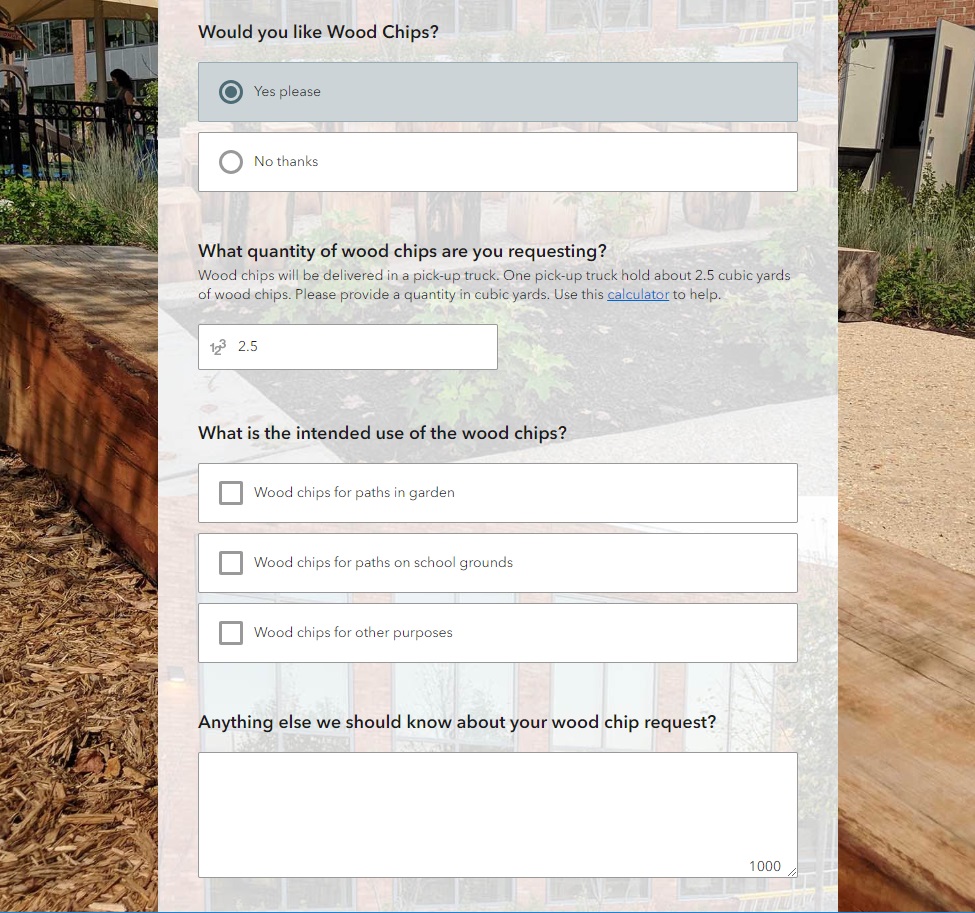
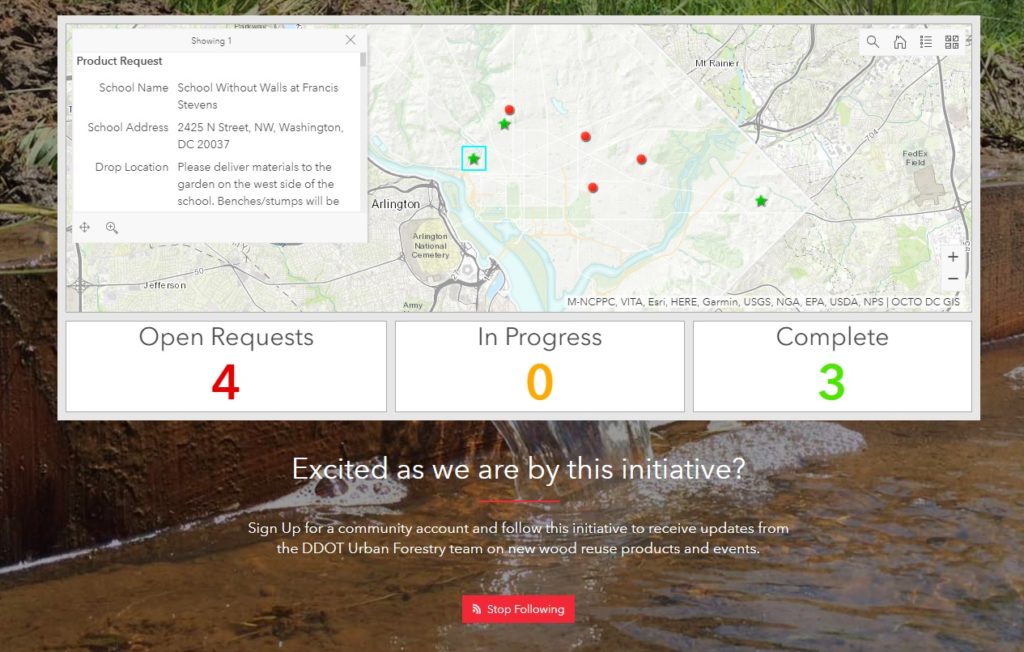
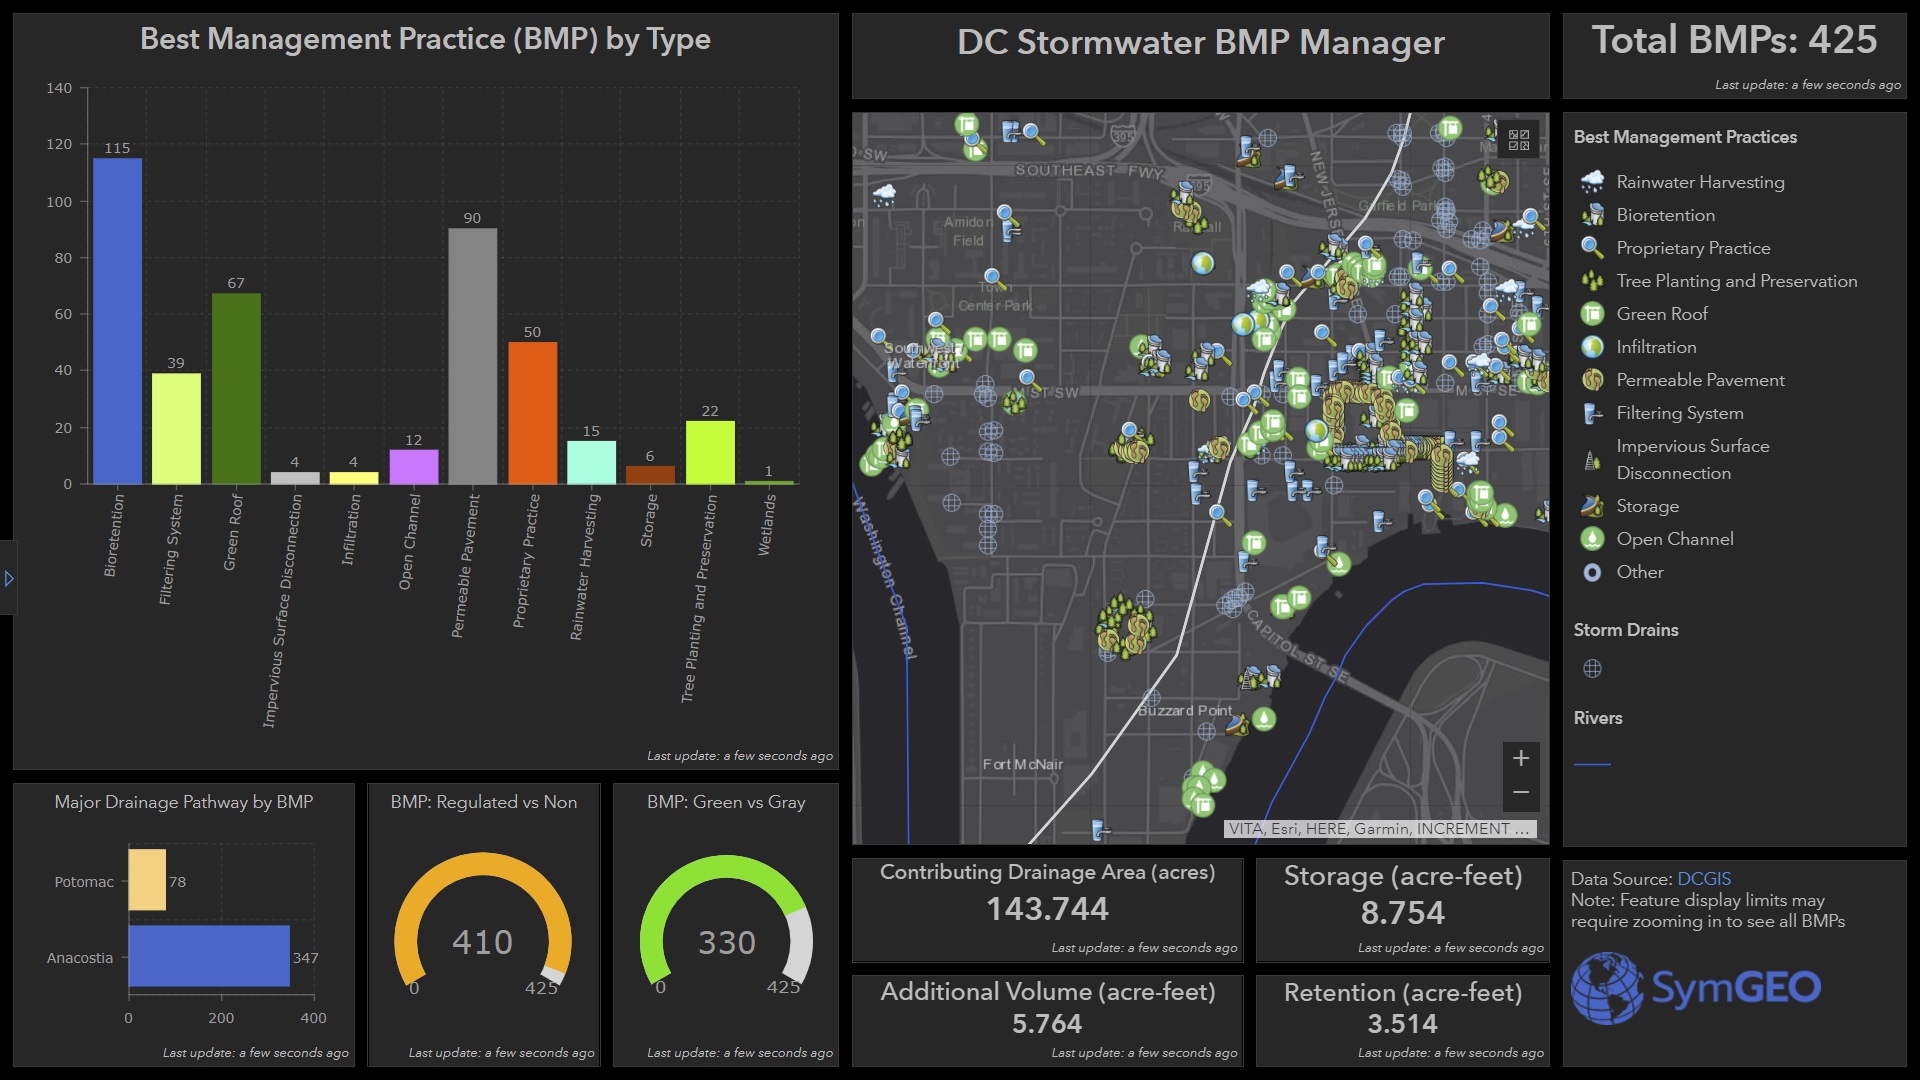
SymGEO is pleased to announce the development of two new D.C. forest structure datasets created in partnership with DDOT Urban Forest Division, using LiDAR data managed by OCTO and the DC GIS program. The final version of this dataset will help Urban Foresters manage the canopy by providing important attributes including tree height, canopy width, and forest structure information.

A little background: LiDAR data is a digital cloud of millions of elevation points typically gathered by a low-flying airplane or ground-level vehicle. The elevation is recorded at every surface the measuring laser beams hit, so in the case of a forest, it will capture the top of the trees, some branches, as well as under-story vegetation and ground elevation. The LiDAR used for this project was also classified by the provider into a number of useful categories, including buildings, ground, and high / medium / low vegetation.

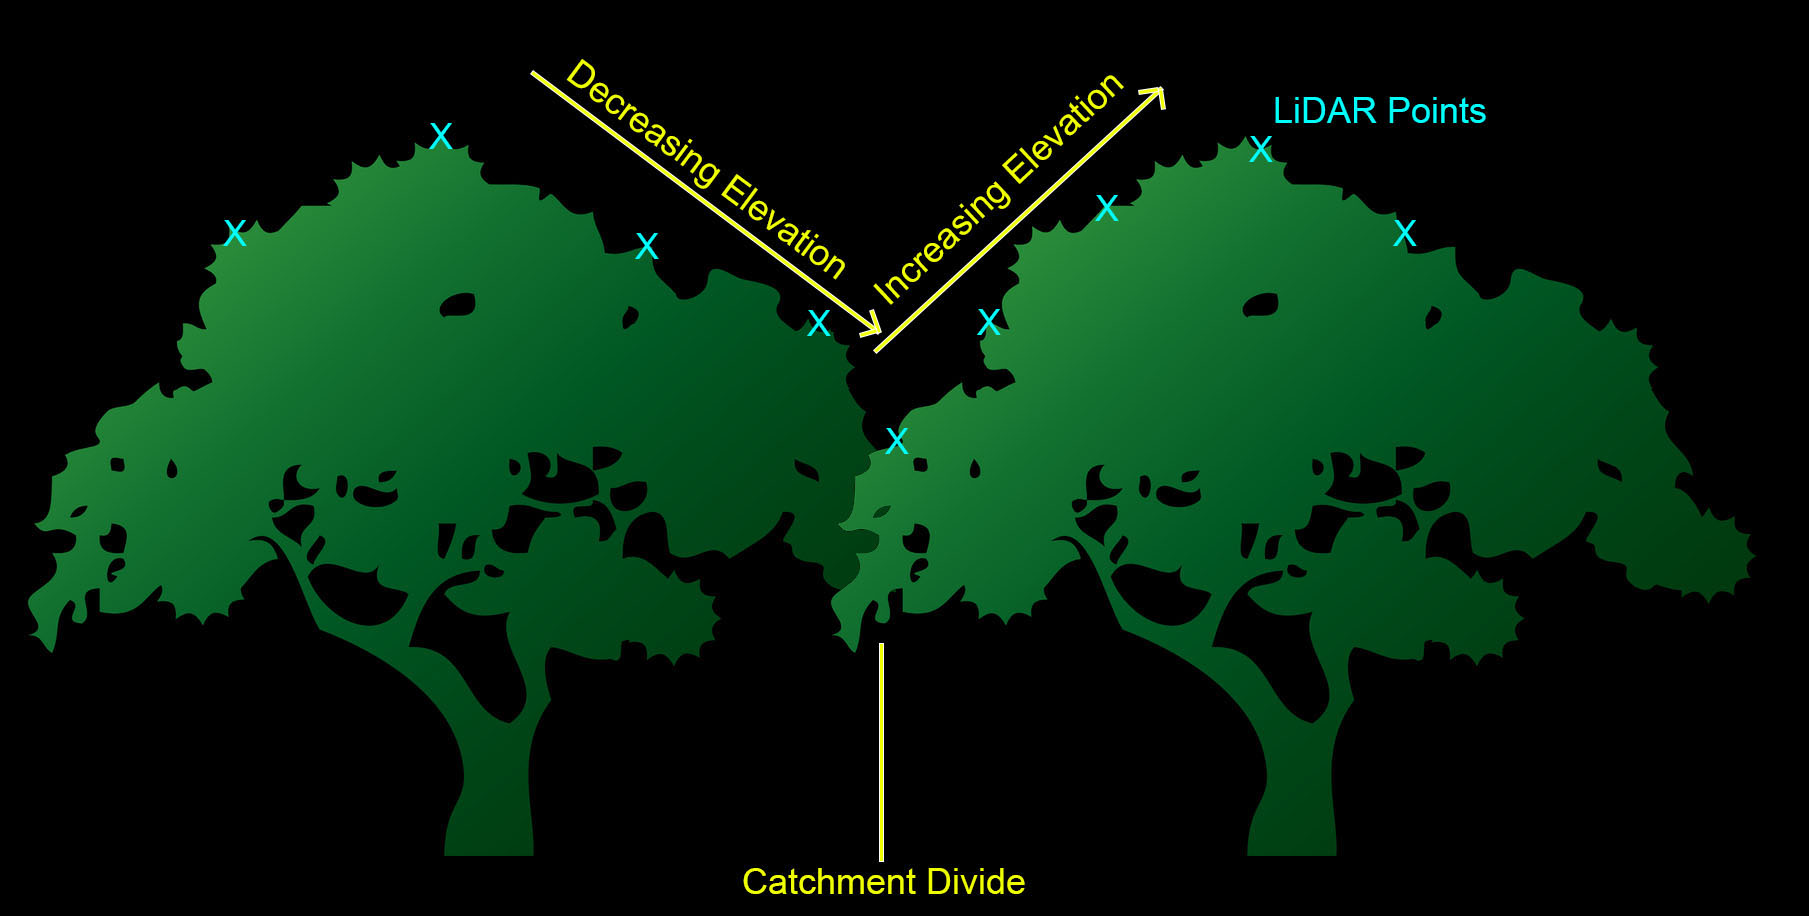
Using an innovative method, SymGEO used the ArcHydro toolset to create “catchment” areas for each tree, with tree locations being determined by the UFA Street Trees dataset. Each tree point was given an artificially high elevation value, and then all surrounding vegetation points around the tree point were examined. If the model determined that the vegetation points were connected to the tree, then it was included in the catchment. If an adjacent tree was found (indicated by adjacent vegetation elevation points increasing in height), then the catchment was divided into the two tree areas. Kind of technical, but maybe the graphic below will help 🙂

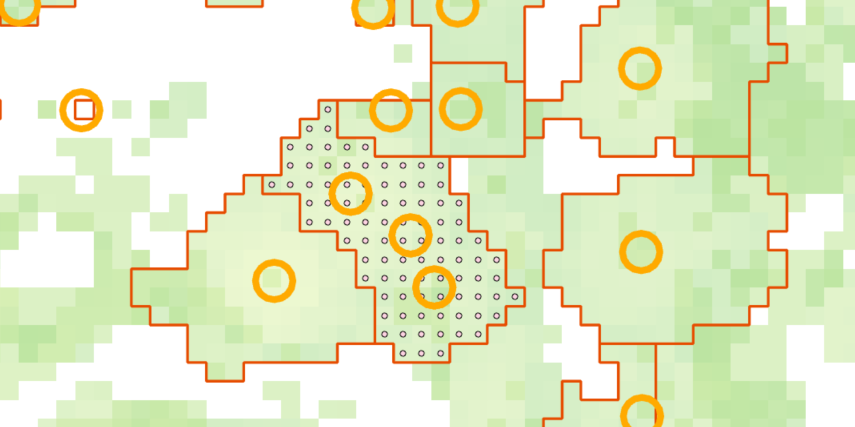
This catchment method worked quite well; however, it did suffer from capturing multiple trees in the same catchment. Fortunately, these cases were isolated quite easily be doing a spatial join between the catchment areas and street tree points, and identifying many-to-one joins.

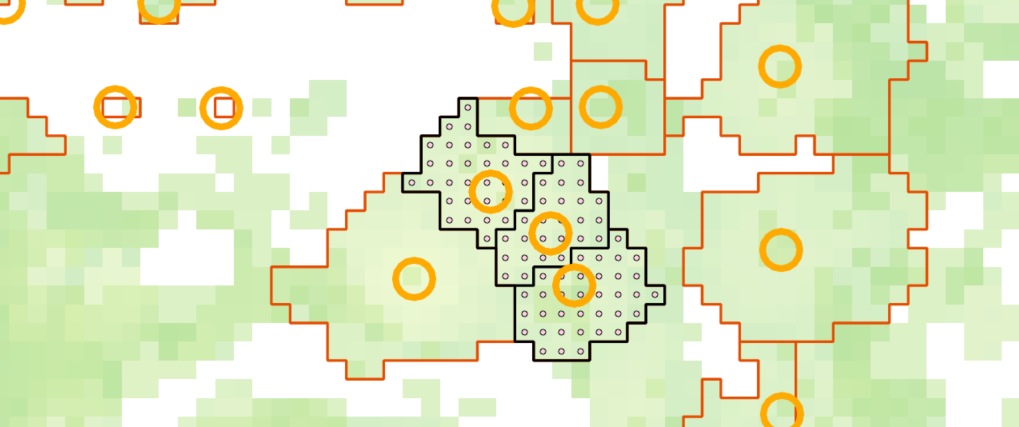
For these cases, the catchment areas were converted into a grid of points, and the points were joined to the nearest tree. They were then back into areas (with the new tree ID as an attribute), effectively splitting up the area into smaller areas that had a one-to-one join with the tree points.

Once the tree area was established and cleaned up through manual inspection of outliers, attributes including tree height and average canopy width are assigned to each tree. These attributes will help the Urban Forestry Division manage the tree canopy even more effectively.

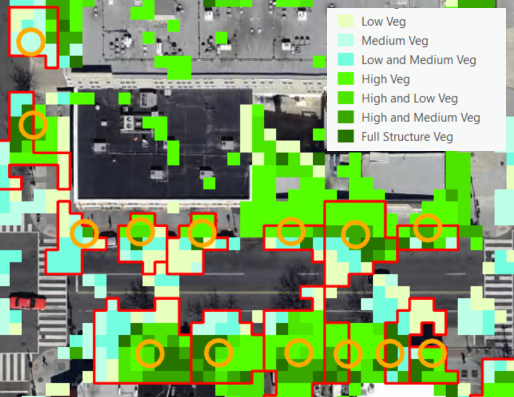
A secondary dataset was also produced using the LiDAR data that categorized areas into high, medium, or low vegetation, so some combination thereof. This helps the Urban Forestry Division prioritize areas for under-story plantings or the establishment of new urban canopies. This data set suffered a little from miscategorized LiDAR points, but it is a good starting point for an urban canopy structure dataset.

If you have access to a LiDAR dataset, and are interested in learning more about derivative products, contact us today – SymGEO is here to help!

School Recycling: Urban Wood Reuse

Teaching kids the importance of nature, recycling, history, and culture is a lofty goal. Perhaps it’s a lesson that could be taught from the comfort of a bench constructed from recycled urban wood sourced from a local DC neighborhood rich in cultural history? This is now possible thanks to the District Department of Transportation (DDOT) Urban Forestry Division (UFD)’s new initiative called “Urban Wood Reuse: for Schools“. This partnership with the Office of the State Superintendent of Education (OSSE) will provide DC Public Schools and public charter schools with wood products to improve school grounds at no cost.

SymGEO was excited to help the Urban Forestry Division (UFD) develop this initiative by using Esri’s ArcGIS Hub technology to establish two-way communication between the UFD and DC schools interested in “sitting on a piece of DC History”. The site shares knowledge and products from the UFD while gathering the school’s product ideas and requirements.

The site discusses the benefits of wood reuse, where the wood comes from, and the variety of products available including benches, stumps, or woodchips. It also provides a link to an order form as a convenient and easy way to request wood products.

The order form itself is powered by Esri’s Survey 123 for ArcGIS technology and is designed with step-logic where pertinent questions appear based on previous answers.

One of the exciting new aspects of an initiative is the ability for an audience member to sign into a community account and “follow” the initiative. This will grant them access to broadcasts about new events, updates, new product launches, and other useful information. Now, being able to show which schools are as excited as we are about this new initiative has never been easier!

Talk to our digital platform experts today if your agency or organization is interested in community engagement with the power of Esri ArcGIS Hub Initiatives – SymGEO is here to help!

DDOT Urban Forestry Division Hub

SymGEO is pleased to announce the launch of the DDOT Urban Forestry Division Hub! This new digital platform is designed to engage and interact with the DC community and provide information about the many services and resources offered by the Urban Forestry Division (UFD) of the District Department of Transportation (DDOT). This digital platform was built using Esri’s ArcGIS Hub technology, in coordination with OCTO and Open Data DC.

With a long history of caring for the extensive forest canopy in DC, the Urban Forestry Division has meticulously assembled data sets and applications to help in their forest management mission and to communicate with a variety of audiences. With the introduction of Esri’s ArcGIS Hub technology, there is finally a digital platform perfectly designed to tie all the pieces together into a cohesive story. SymGEO was honored to be approached by the Urban Forestry group to help them design, configure, and deploy this comprehensive digital solution.

“SymGEO is a remarkably flexible and responsive company. They listen carefully to requirements and deftly blend customer vision with technological capabilities.”

DDOT Associate Director / State Forester, Urban Forestry Division

The urban forest story begins with a look to the past and introduces the audience to the long history and important role of trees in DC.

history

The story then turns to the impressive variety of trees available for public enjoyment and leverages several applications and digital stories that the urban forestry group has already developed.

canopy

The flagship data set of the Urban Forest group is the Public Tree Map which elegantly displays a tremendous amount of current information about the urban tree canopy. Links are provided to both the map and the underlying data for the community to use and explore.

public tree map

Work orders, permits, inspections, plantings, removals… there’s a lot going on in Urban Forestry! Fortunately, many data sets and reporting mechanisms have been developed to keep track of it all. These have now been shared with the public under one digital roof for a better understanding of agency scope and status.

urban forestry maps

Of course, what fun are statistics if they can’t be updated on the fly as new information is entered into databases behind the scenes?

stats

Finally, links to tools and resources are provided for partners and stakeholders to begin making their own applications and discoveries with DC government data.

tools

Talk to our industry experts if your agency or organization is interested in leveraging the power of Esri’s ArcGIS Hub – SymGEO is here to help!

Land Area by Zoning

Ever wonder how much land area there is in DC by zoning district or specific zone? Well, wonder no more, as we sliced and diced the data, and created the DC Land Area Explorer by Zoning Type. This application leverages Esri‘s select by chart category functionality in ArcGIS dashboard. Data is kindly provided by our friends at DC Office of Zoning (DCOZ),  the Department of Consumer and Regulatory Affairs (DCRA), and a fabulous basemap by OCTO’s DCGIS team.

Users can select zoning categories or specific zones by clicking on the bars in the charts. This will update the total recorded land area calculation to just the selected zone(s). Alternatively, for really detailed analysis, zooming into the map and using the “select” tool in the map window allows the selection by zoning district, specific zone, or even property boundaries.

Take a look at the DC Land Area Explorer by Zoning Type, and if you have data you’d like sliced, diced, sauteed or… you know who to contact!

Waze Traffic in DC

Waze and Esri recently announced an expanded partnership, giving cities easier access to traffic conditions data and incident reports. Esri also has a traffic layer updated every 5 minutes, with road closure notices and other important information included. By combining these near real-time data sources with the marvels of modern technology, SymGEO is pleased to unveil the DC Traffic Dashboard.

Use the DC Traffic Dashboard to plan your commute, see what’s in store, or enjoy your day of telework that much more! Contact SymGEO for more info or for your own handy-dandy dashboard.

Stormwater BMPs in DC

Did you know that when heavy rain falls in an urban environment, most of it will run off the roads and buildings into concrete channels and quickly dump into streams and rivers? This “stormwater” can be very damaging, as all the water enters into the streams at virtually the same time, so channel erosion and water quality are serious concerns. In natural environments, the water is slowed down and filtered by things like trees, wetlands, soaking into the ground and moving through the landscape.

To help mimic the function of the natural environment, urban planners and municipal engineers construct stormwater “Best Management Practices” (or BMPs) to help filter and slow down the water on its way to the nearest stream. Stormwater BMPs may include structures such as reservoirs, green roofs, permeable pavement, filtering ponds, or rainwater harvesting among others.

Keeping track of all those stormwater BMP assets is a challenge, so SymGEO has built the DC Stormwater BMP Manager to help. This configurable application uses an ArcGIS Dashboard template, and shows a select set of data attributes to display the characteristics and capabilities of local stormwater BMPs.

The data is coming directly from DC OCTO / DCGIS data servers, shared through Open Data DC. This powers the application with the authoritative data sets, and any updates to the data are immediately reflected in the manager dashboard. All statistics are calculated based on the stormwater BMPs within the view window, allowing interactive explorations around the city.

If only a certain subset of data is to be investigated (say by BMP type, or by green vs gray infrastructure), a left-hand panel can be opened to filter the data. All statistics and the map window are linked to those filters, and additional data about each BMP can be accessed by clicking on the BMP feature.

Give the DC Stormwater BMP Manager a spin, and imagine the possibilities using your own data. Contact us for more information on how to effectively display and share your digital assets!