Pittsburgh Permit & Area Alert System

Building Smarter Civic Notifications: Inside the OneStopPGH Permit & Area Alert System

Cities generate an enormous amount of data every day – but too often, that data remains difficult for the public to access in a meaningful, timely way. At SymGEO, we focus on turning complex geospatial systems into intuitive, actionable tools.

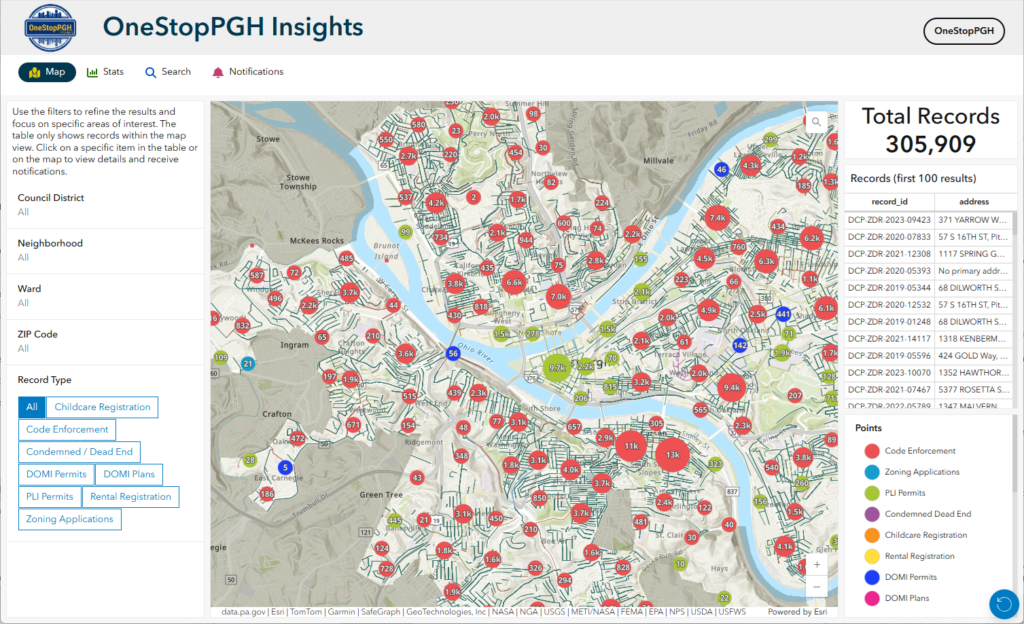
The OneStopPGH Insights platform from the City of Pittsburgh is a strong example of that philosophy in action: a scalable, map-driven notification system that keeps residents, businesses, and stakeholders informed about permit activity – automatically.
From Static Data to Real-Time Awareness

The request to SymGEO was straightforward: Give users the ability to track changes to permits or geographic areas they care about, without requiring them to constantly check a website.

The result is a self-service subscription system where users can:

  • Follow a single permit
  • Monitor activity within a defined area (neighborhoods, council districts, zip codes, etc.)
  • Receive automated email updates when changes occur
  • Easily unsubscribe at any time

All of this is delivered through a seamless, map-based experience.
“SymGEO has been an exceptional partner in helping us turn complex permitting data into something clear, accessible, and meaningful for our residents. The OneStopPGH notification system reflects exactly what we aim for as a City – modern, transparent tools that empower the public and reduce barriers to information. This solution not only enhances how our community stays informed, but also strengthens the foundation for how we deliver digital services moving forward.”

– Senior Manager – Applications, City of Pittsburgh

A Simple, Intuitive User Experience

The system was designed to feel natural for anyone already familiar with interactive maps.

Subscribing to a Single Permit

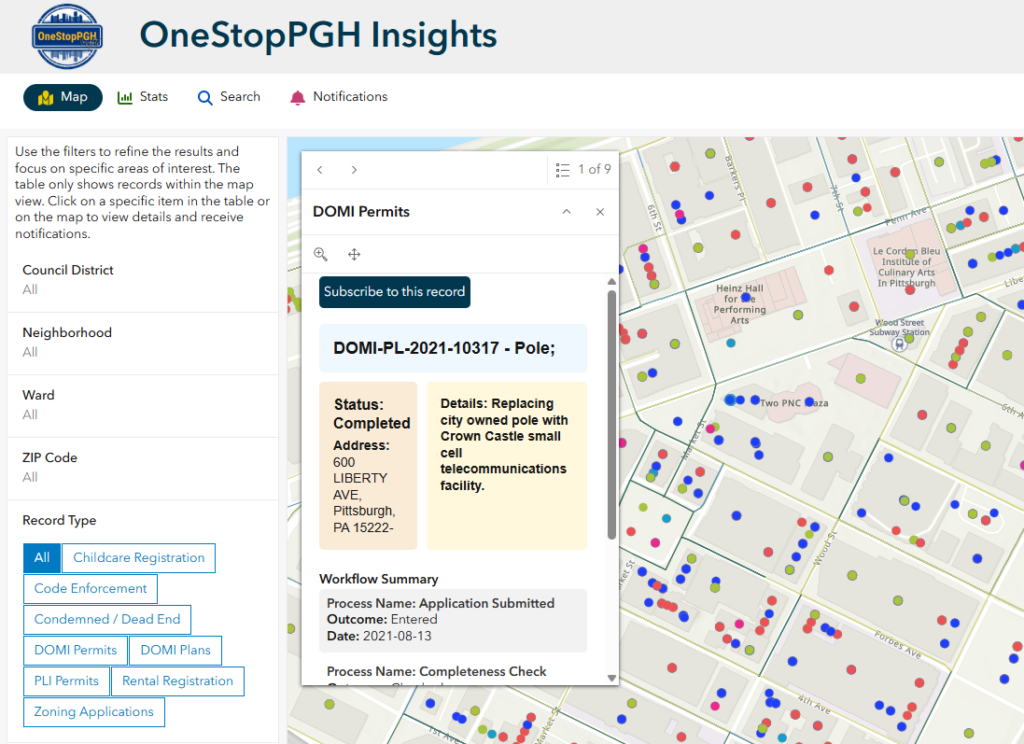
Users explore the public web app, click on a permit point, and subscribe directly from the map. Behind the scenes, a lightweight form captures their request, and they immediately receive a confirmation email with links to:

  • View the permit in a live dashboard
  • Unsubscribe with a single click

Subscribing to an Area of Interest

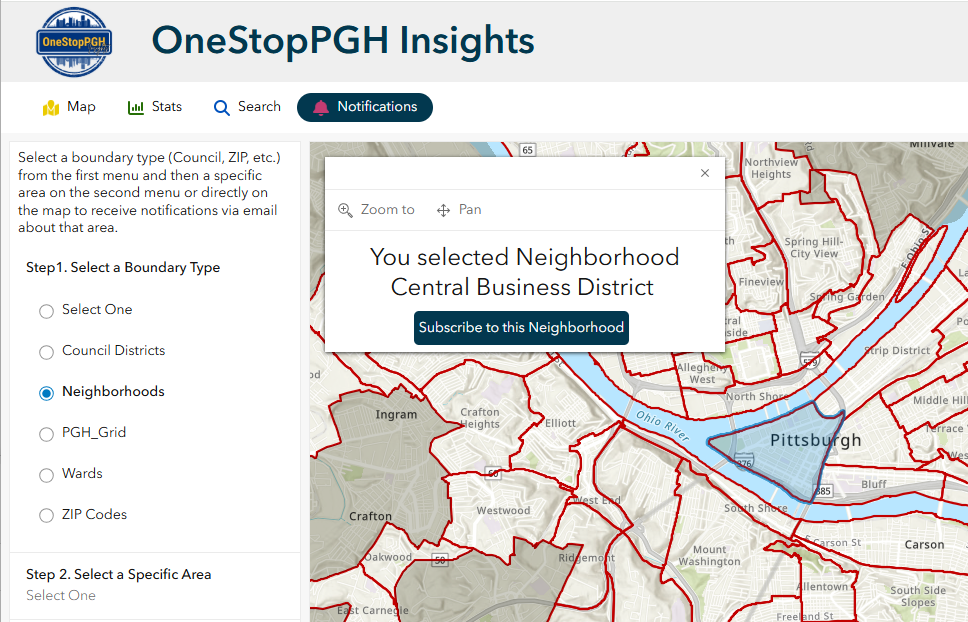
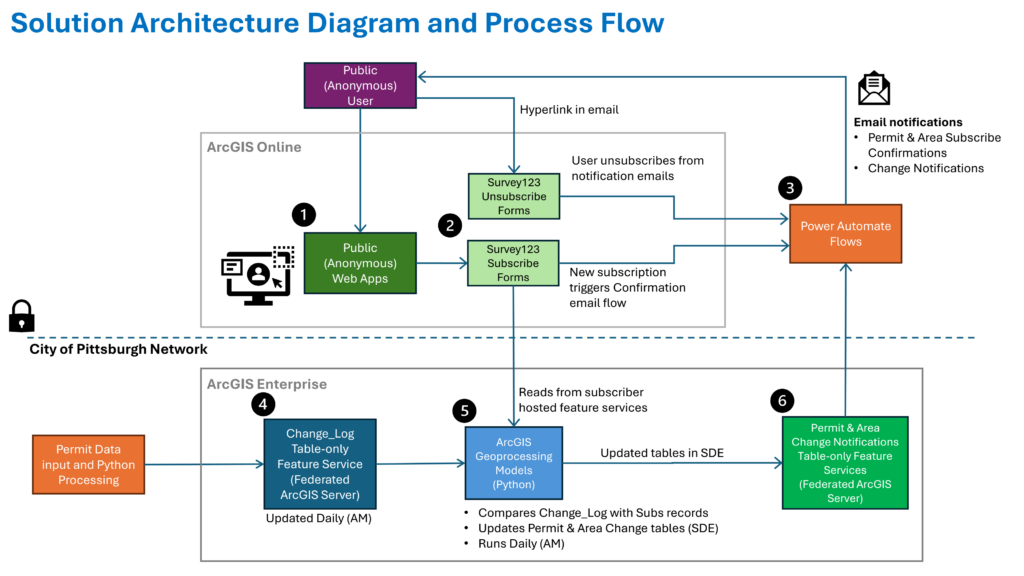
For broader monitoring, users can navigate to a notifications panel, select a geography (like a neighborhood or council district), and choose the types of records they care about. From there, the system handles the rest – tracking relevant changes and delivering updates automatically.
The Technology Behind the Experience

While the user experience is simple, the architecture behind it is intentionally robust and scalable.

The solution combines:

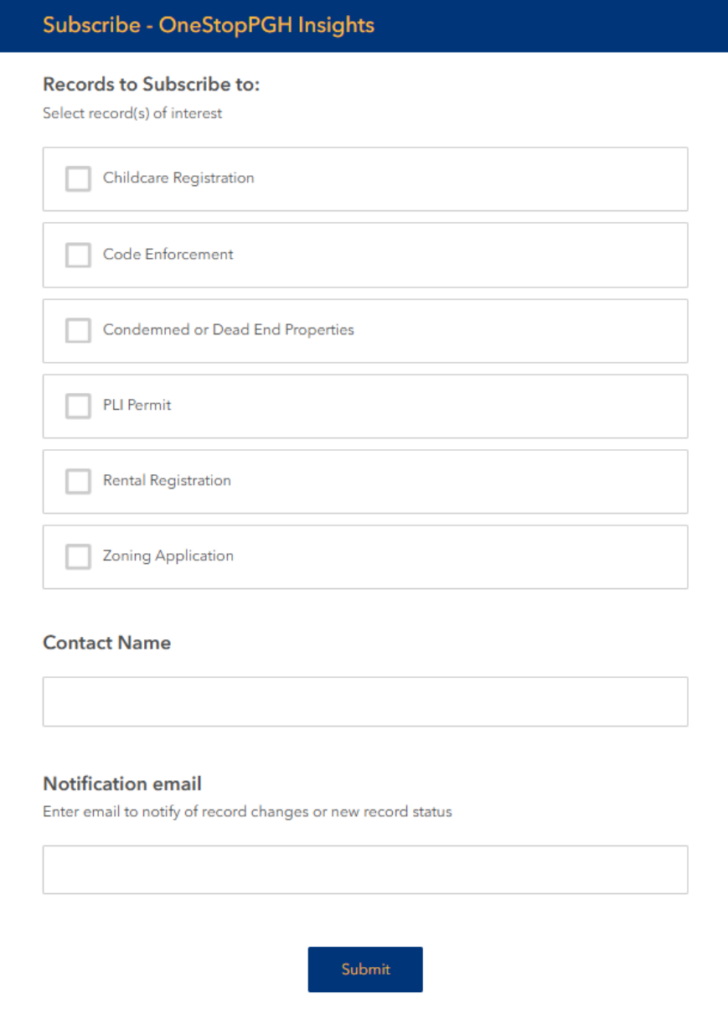
  • ArcGIS Online for public-facing applications and user interaction
  • ArcGIS Enterprise for authoritative data management and spatial processing
  • Survey123 for structured subscription and unsubscribe workflows
  • Microsoft Power Automate for orchestrating notifications

This hybrid approach allows the system to balance public accessibility with enterprise-grade reliability.
Why Architecture Matters

Rather than relying on real-time queries or tightly coupled systems, we designed the platform around precomputed change detection.

Each day:

  1. Source permit data is updated within the City’s GIS environment
  2. Automated models identify what has changed
  3. Changes are resolved to:
    • Individual permits
    • Subscribed geographic areas
  4. Results are written to staging tables
  5. Power Automate sends targeted email notifications

This approach avoids:

  • Heavy real-time spatial queries
  • API bottlenecks
  • Performance instability during peak usage

And it ensures:

  • Predictable system performance
  • Easier troubleshooting
  • Long-term maintainability

Built for Scale and Sustainability

A key design principle was keeping authoritative processing inside the City’s infrastructure while allowing public interaction to remain lightweight and anonymous.

The system is:

  • Decoupled – user actions don’t directly trigger heavy backend processing
  • Auditable – all notification logic is traceable through staging tables
  • Maintainable – clear separation between GIS, automation, and user interfaces

Operationally, the platform is supported by:

  • Daily automated data pipelines
  • Scheduled change detection scripts
  • Monitoring workflows for subscriptions and system health

Real Impact for Cities and Communities

The OneStopPGH notification system transforms how users engage with civic data:

  • Residents stay informed about development in their neighborhoods
  • Businesses can monitor permits affecting operations or investments
  • City staff reduce manual communication overhead

Most importantly, it creates a transparent, proactive communication channel between local government and the public.
A Blueprint for Modern Geospatial Engagement

This project demonstrates a repeatable pattern for cities looking to modernize how they share information:

  • Start with authoritative GIS data
  • Add intuitive, map-based interaction
  • Use automation to deliver timely insights
  • Design for scale from day one

At SymGEO, we believe the future of geospatial isn’t just about maps – it’s about delivering the right information to the right people at the right time. Contact Us to start a conversation today about your unique project requirements.
DC Office of Zoning Handbook

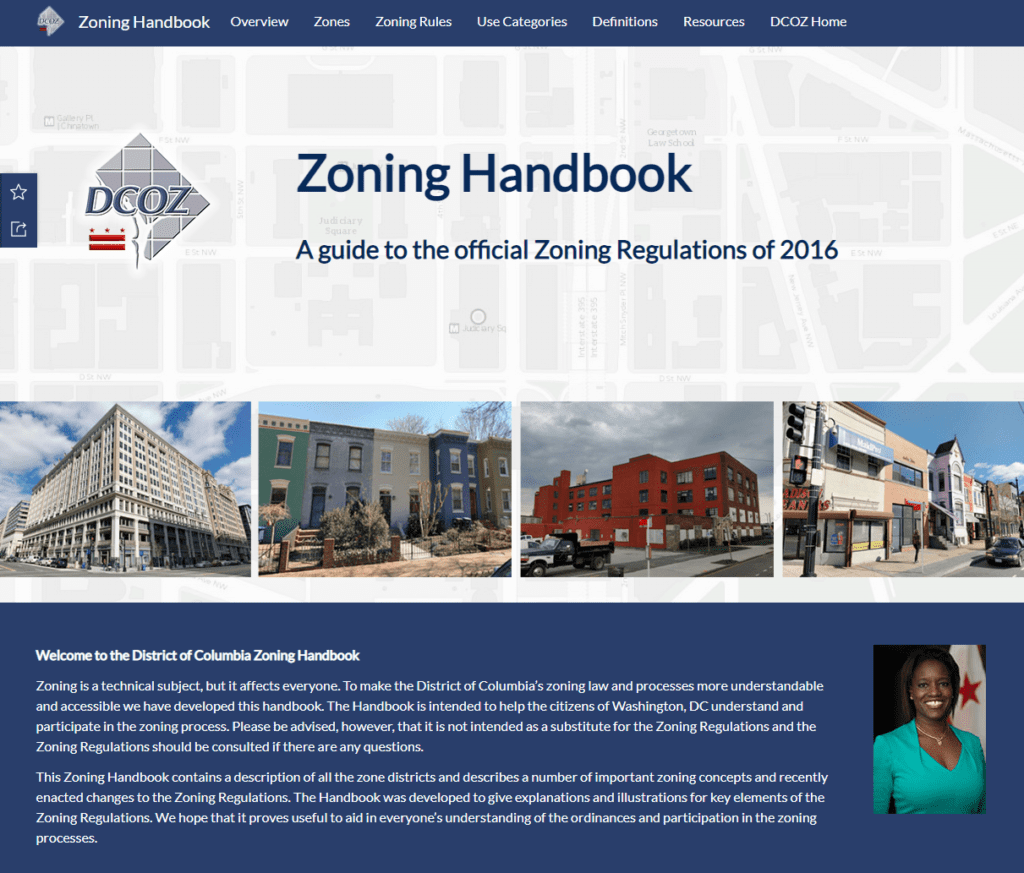
The District of Columbia Office of Zoning (DCOZ) is responsible for communicating zoning rules and regulations to District residents. To facilitate this flow of technical information, DCOZ partnered with SymGEO to develop the next-generation DC Zoning Handbook, built using ArcGIS Hub technology.
“The Zoning Handbook is an important resource for District residents to understand and participate in the zoning process. We enjoyed working with SymGEO to migrate existing content, leverage current technology, and develop new solutions to make the process as easy as possible for our audience.”

– Director, DC Office of Zoning

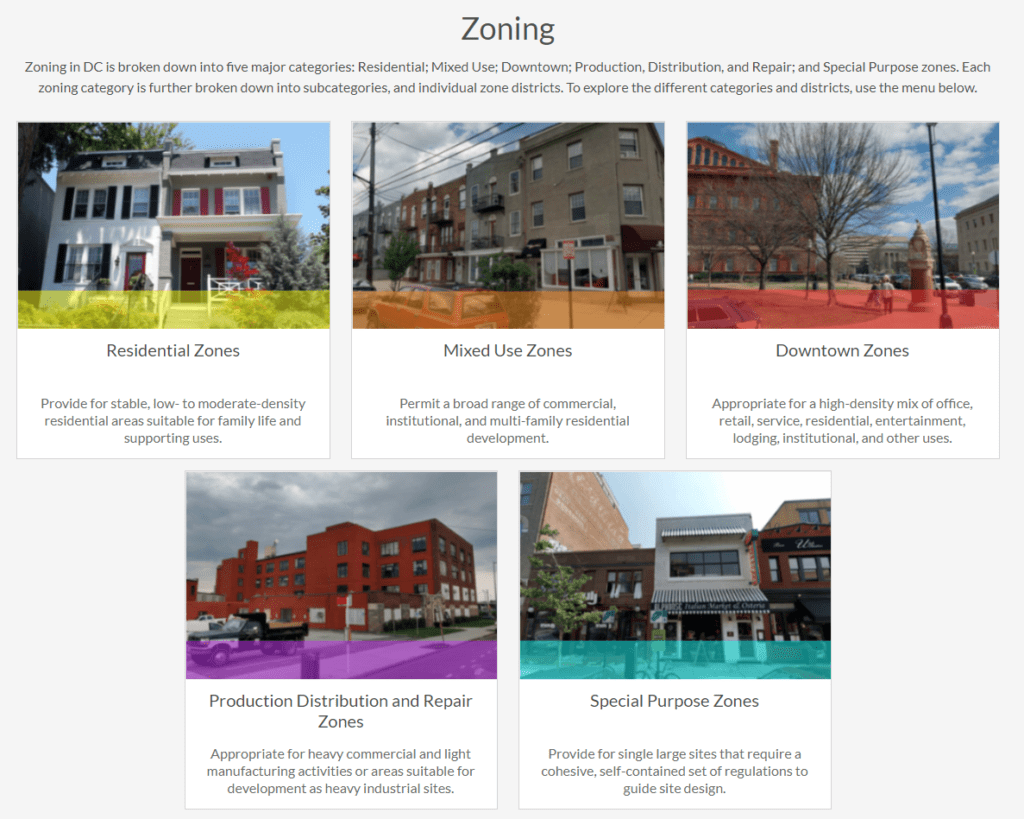
The Zoning Handbook was designed to start at the highest level of information and introduce the concepts and locations of zoning categories.

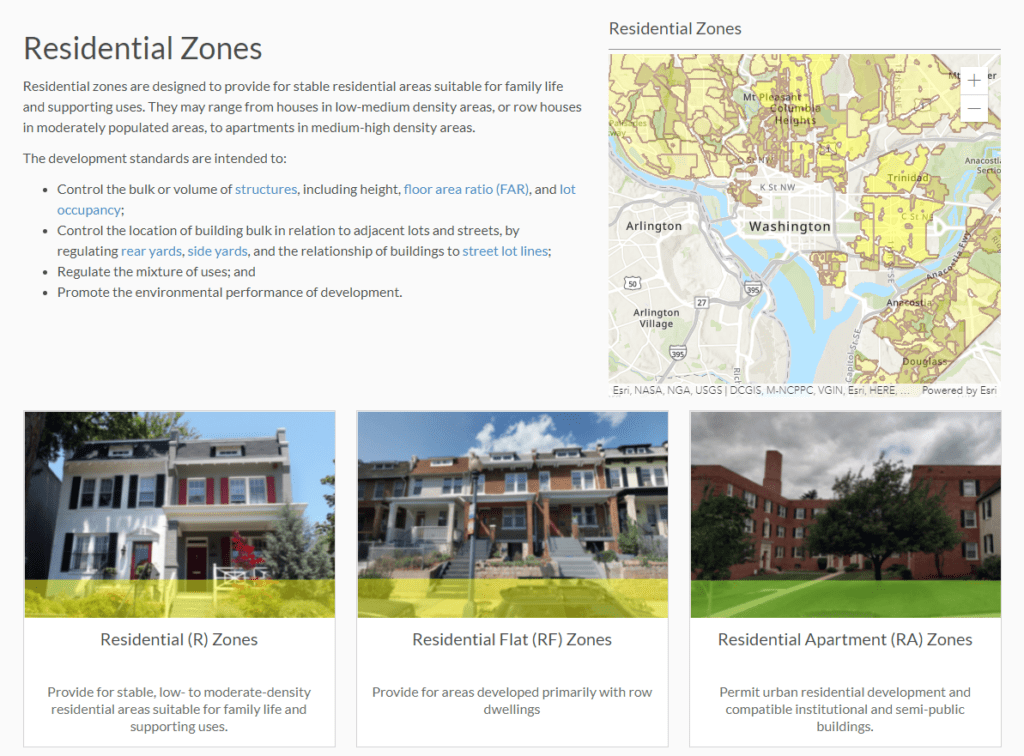
Selecting a general zoning category (such as Residential) drills down into the types of residential zoning in the District.

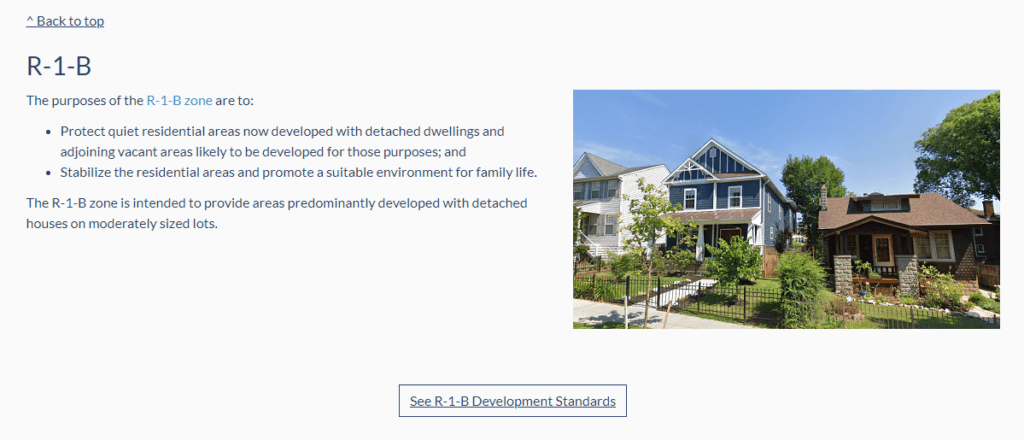
Selecting a type of residential zoning delves into the purposes and intentions of the many variants within that particular zoning type.

At this final level of detail, the development standards for the specific zone are offered using a Development Standards Dashboard, developed using ArcGIS Dashboards, which communicates the technical aspects of the zoning type in a mobile-responsive format.

“The ArcGIS Hub cloud platform enabled us to augment the zoning regulations with interactive dashboards and maps to provide an engaging and informative experience while reducing the need for on-premise servers and applications.”

– Data Coordinator, DC Office of Zoning

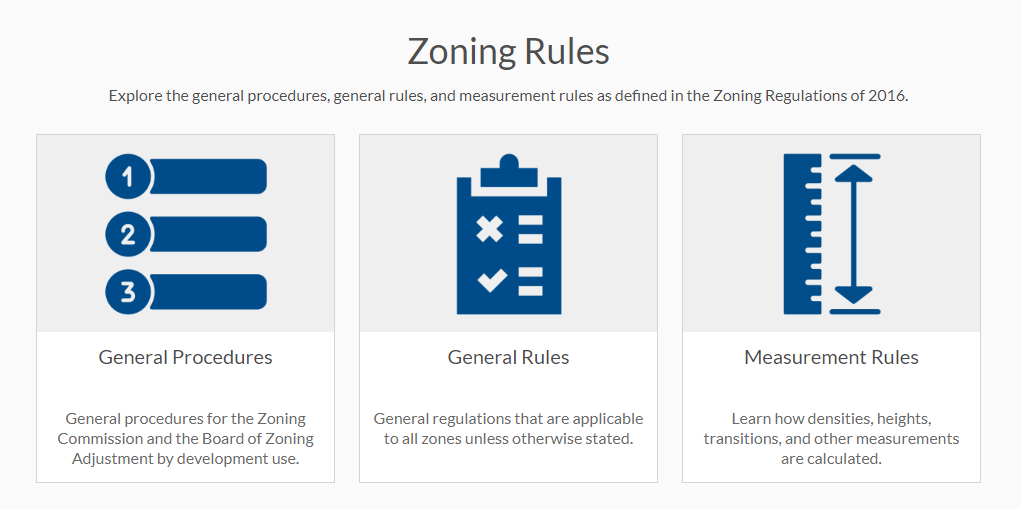
Back on the main page of the Zoning Handbook, insight can be found into the general procedures, general rules, and measurement regulations as defined in the Zoning Regulations.

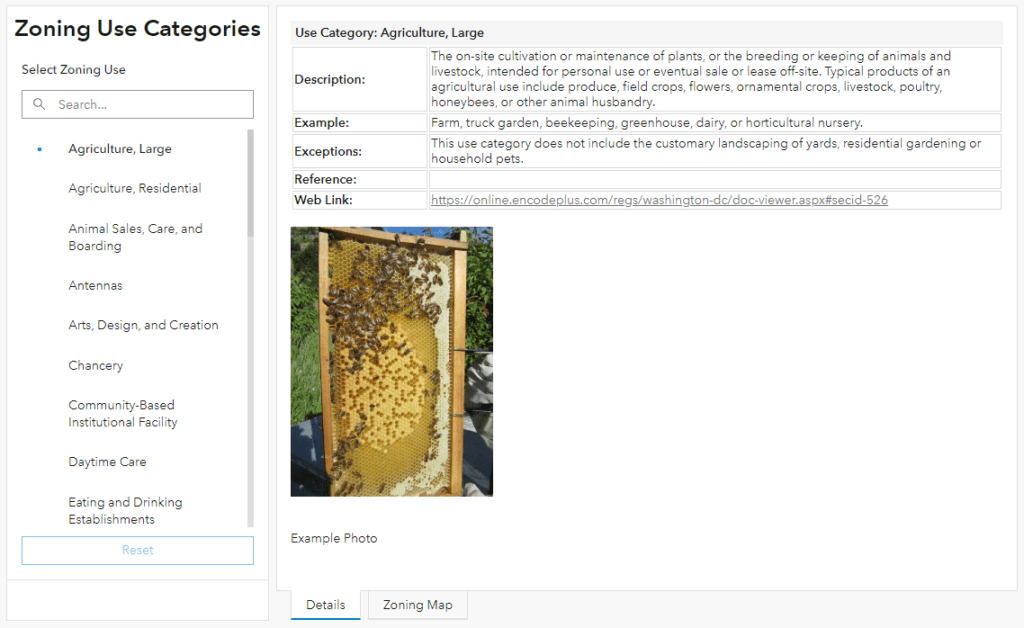
Zoning Use Categories are presented using ArcGIS Dashboard technology in a mobile-friendly format.

A long list of definitions helps District residents navigate the language used in the zoning regulations.

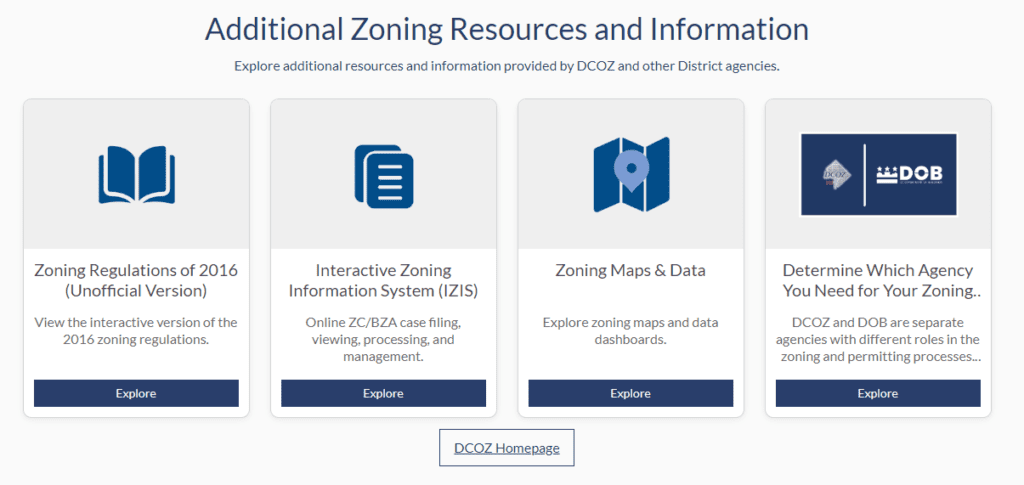
Finally, additional zoning resources and information are offered for further reading and zone exploration.

Talk to SymGEO today if your municipality or agency is interested in migrating web content to an ArcGIS Hub solution – we are certified experts and are here to help.


Vision Zero DC

District of Columbia Mayor Muriel Bowser launched Vision Zero in 2015 to inspire and transform DC’s roadway safety efforts and to set DC’s sights on a goal of zero fatalities or serious injuries on District streets. Since then, the District Department of Transportation (DDOT) has shifted to designing streets that are safe for everyone, working closely with community members to identify problems and build solutions. As part of a new community outreach effort, SymGEO was honored to help DDOT build the new Vision Zero DC website using ArcGIS Hub technology. Read the official press release from DDOT for this exciting website launch, as well as the comprehensive ArcNews article entitled “Washington, DC, Pursues Equity and Transparency in Vision Zero Campaign” featured on the front page of the Spring 2023 edition.

“The new Vision Zero DC website will help us work closely with community members to identify problems and build solutions. SymGEO iterated quickly and efficiently on design ideas and built a very engaging platform solution for DDOT.”

– DDOT Vision Zero Director

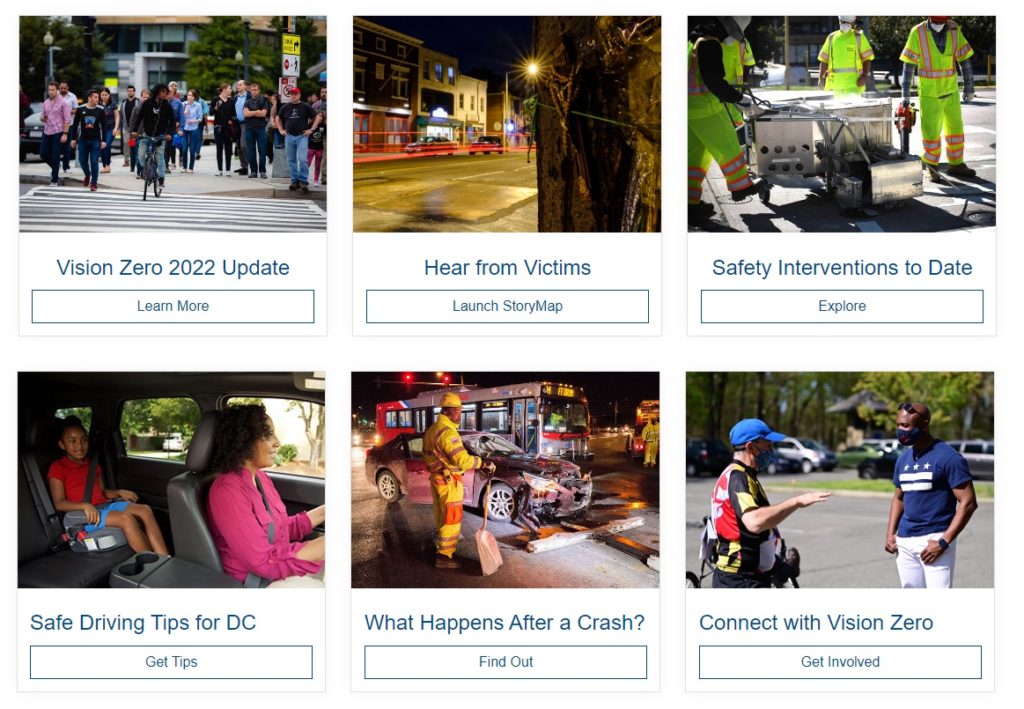
The Vision Zero DC site is organized into easily navigable sections based on audience interest and is designed to be mobile-responsive and broadly accessible.

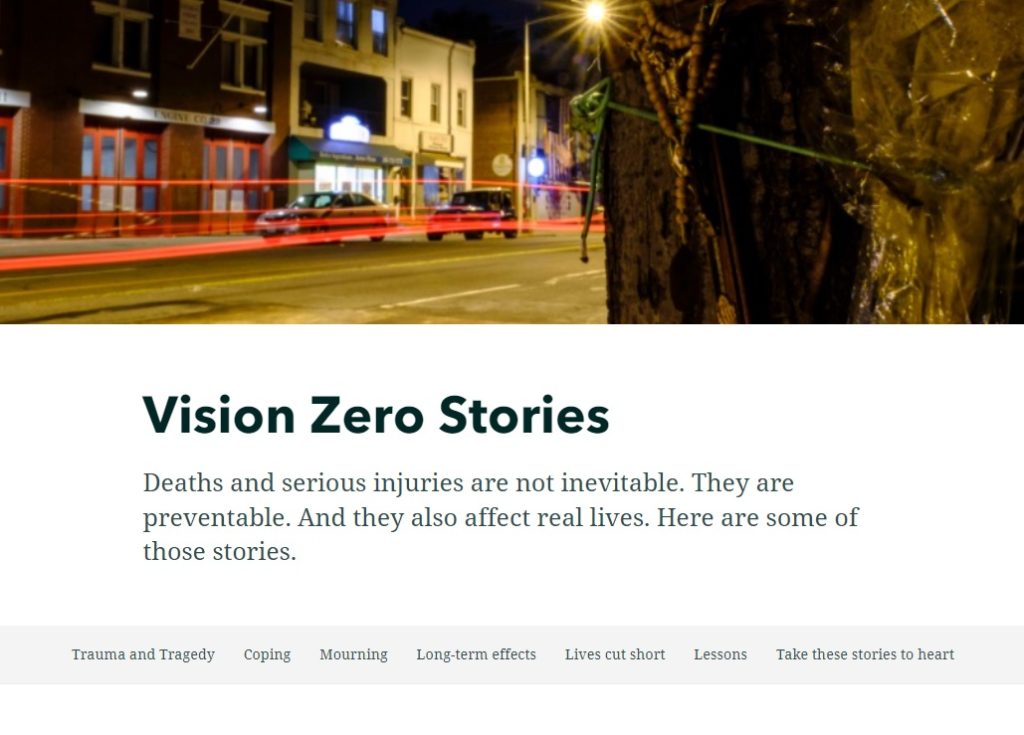
A poignant look at the human costs of dangerous driving and unsafe behaviors is presented in Vision Zero Stories, developed using ArcGIS StoryMap technology.

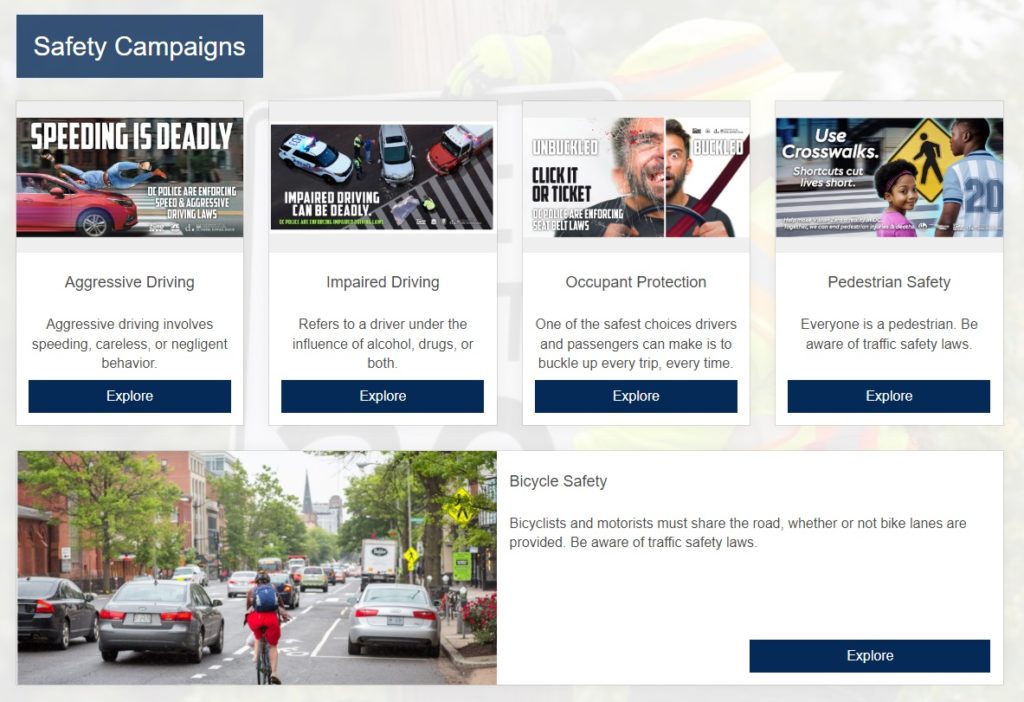
The Education page features educational campaigns that help to promote safe driving and pedestrian habits throughout the District.

The safety campaigns target the biggest threats to the most vulnerable travelers on DC’s roadways. These include aggressive driving, impaired driving, occupant protection, pedestrian safety, and bicycle safety.

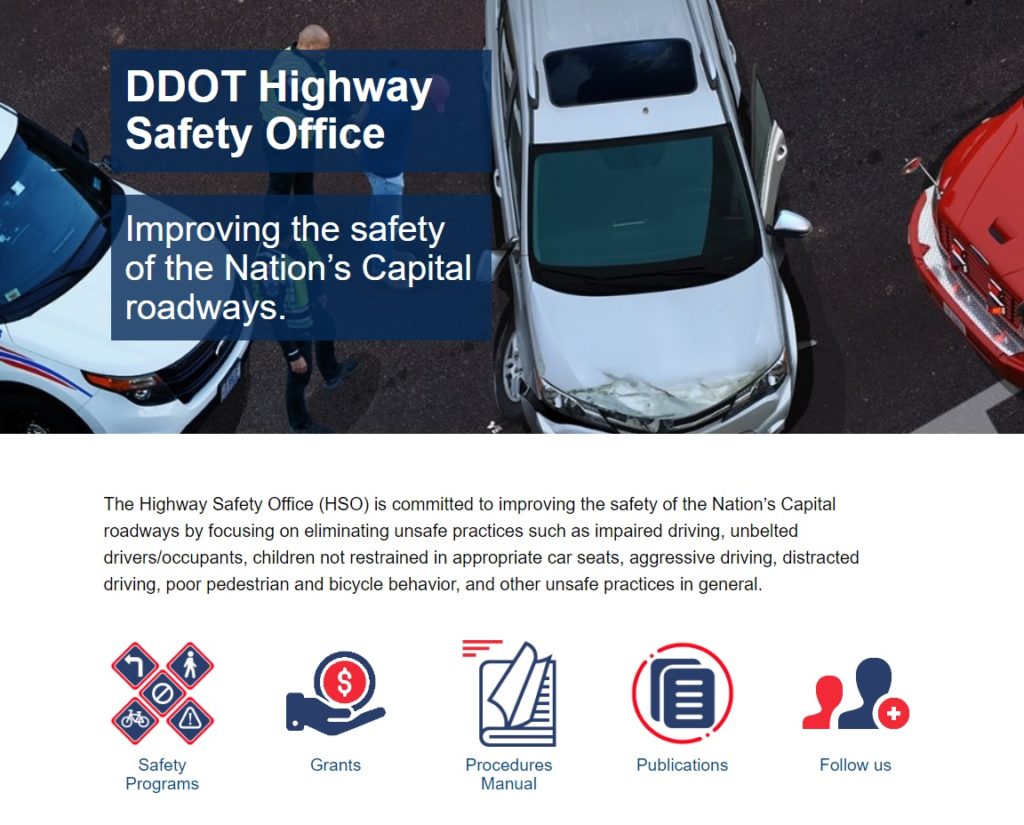
A link is also featured to Safety Grant information housed on DDOT’s Highway Safety Office page. This page also includes many links to safety programs, grants, procedure manuals, and publications.

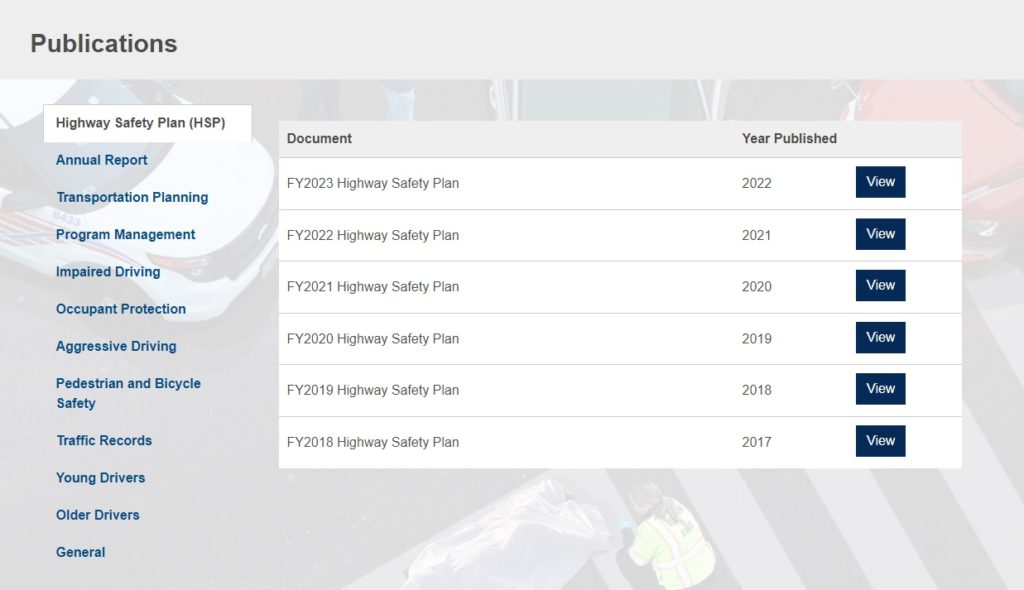
This living document provides links to numerous helpful documents and publications.

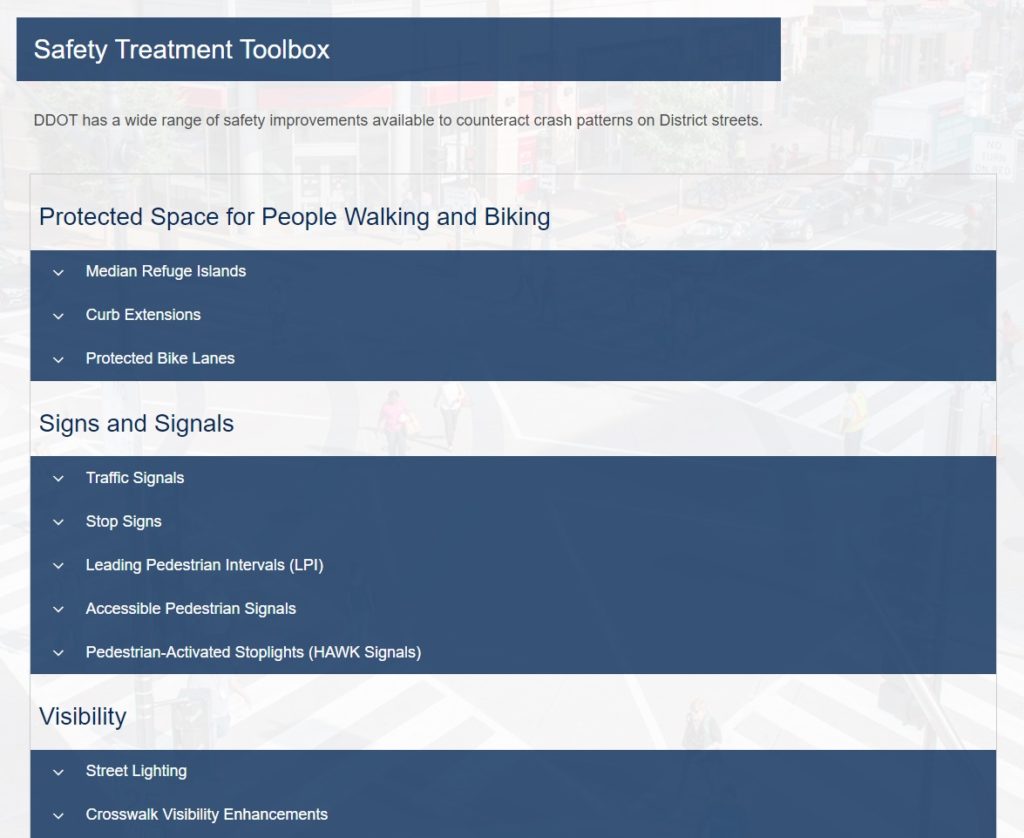
A look at the Engineering page shows the significant progress made in designing solutions to benefit vehicular and pedestrian traffic, conveniently organized into a Safety Treatment Toolbox.

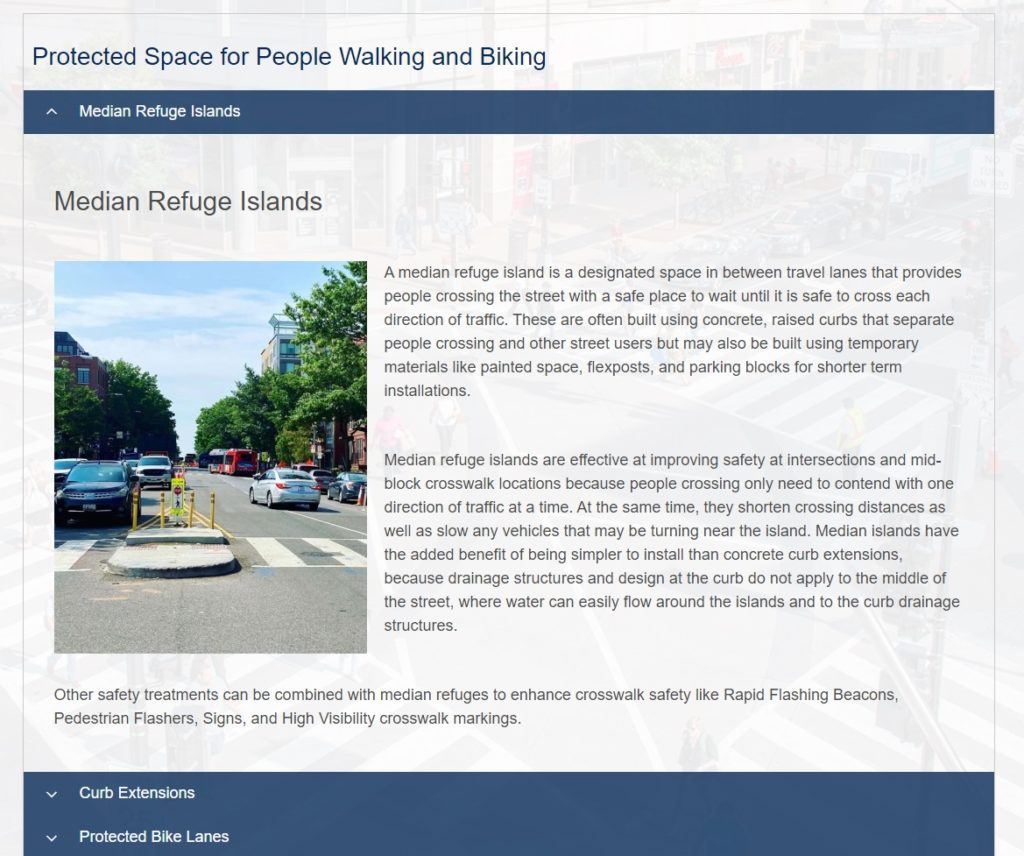
Expanding a section of the toolbox gives a wealth of information about each treatment “tool.”

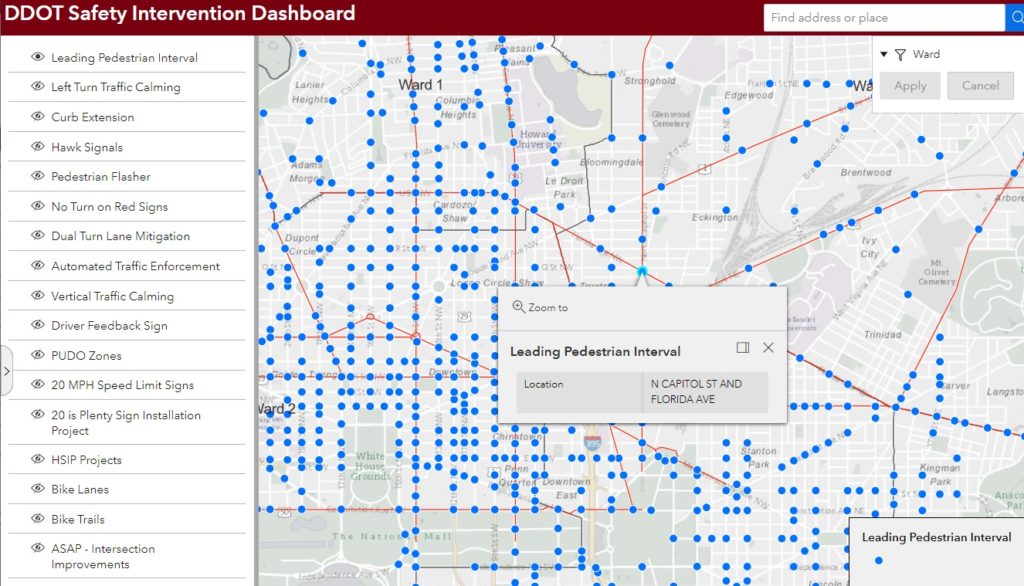
A Safety Intervention dashboard gives insight into all the implementations of the safety toolbox tools that have occurred to date.

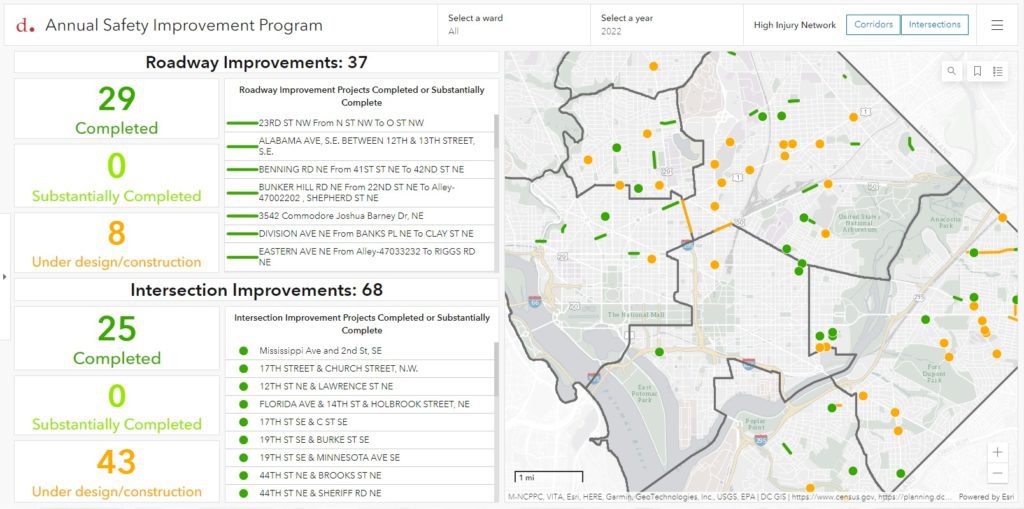
An Annual Safety Improvement Program dashboard gives insight into all the roadway and intersection improvements made to date.

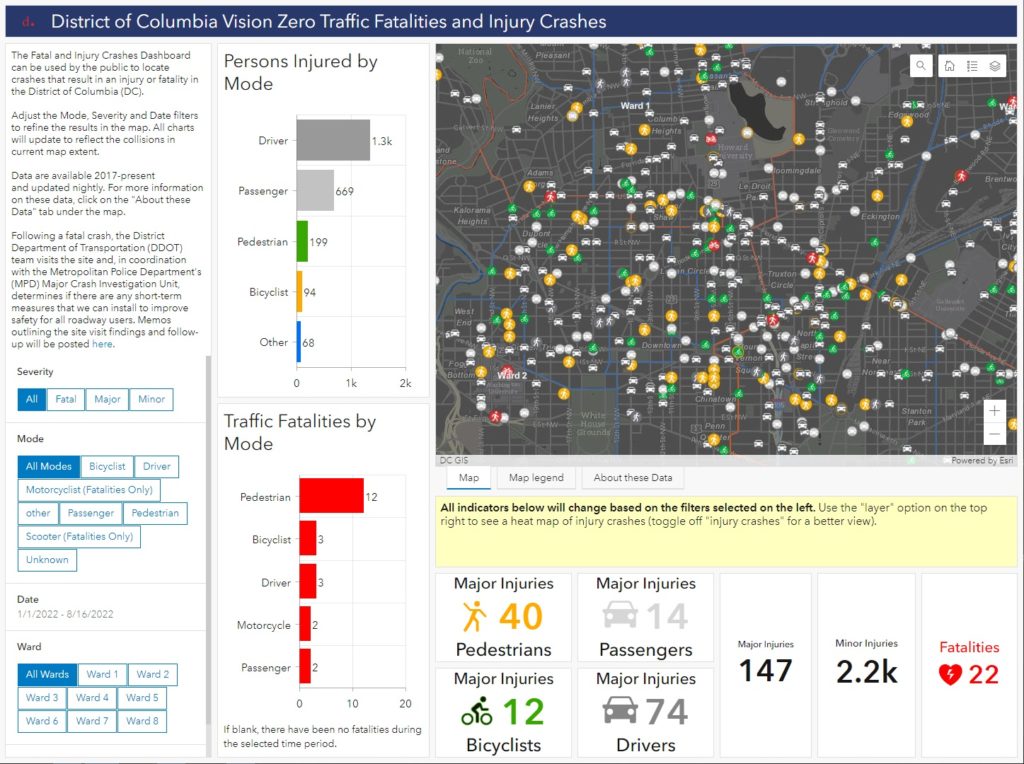
Exploring the Crash Analysis page gives a deep dive into the data fueling the push for zero fatalities on D.C.’s roadways, including a Fatality and Injury dashboard with authoritative data provided by the Metropolitan Police Department.

Talk to SymGEO today if your municipality or agency is interested in setting your sights on a goal of zero fatalities on your roadways using a Vision Zero hub site – we are certified experts and are here to help.

Special Event Operations at DDOT

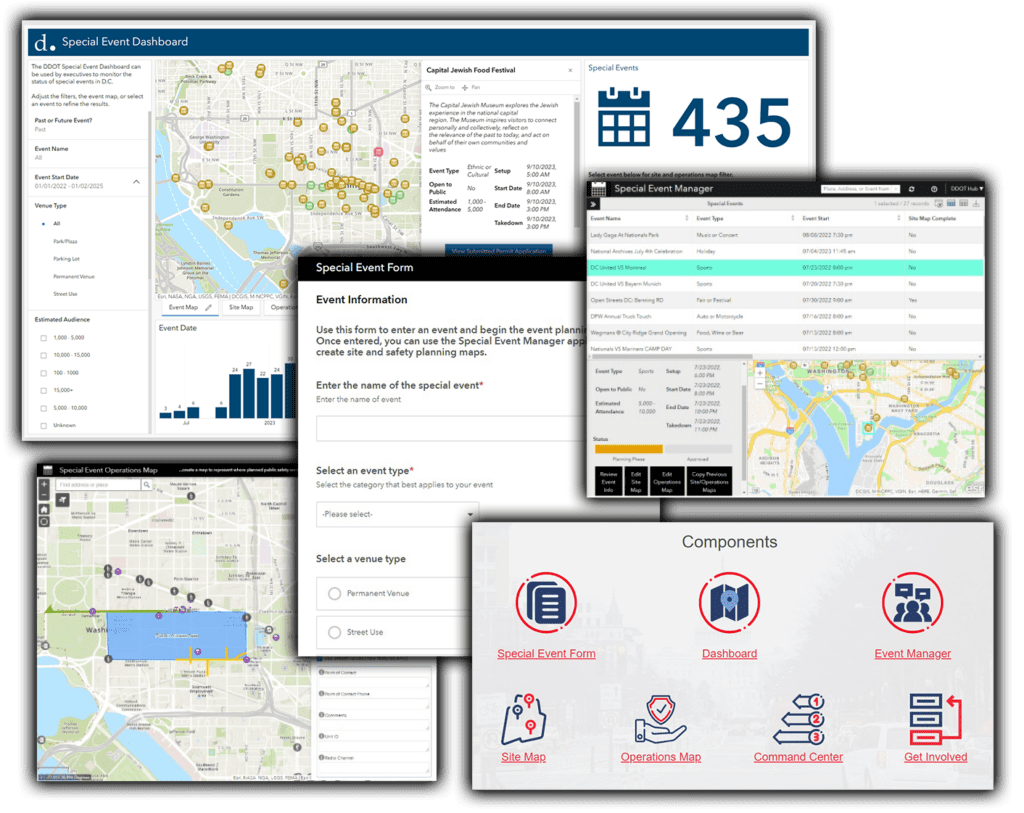
Esri’s Special Event Operations is a configurable solution that helps organize special events, create event site maps, develop health and safety plans, manage event incidents and assignments, monitor public health and safety operations, and create after-action reports. The District Department of Transportation (DDOT) recognized the value of having comprehensive information about an event in one authoritative, collaborative place, and asked SymGEO to help configure and deploy Special Event Operations for their internal use.

“The Special Events solution has sparked a new level of excitement in preparing for special events in the city. With SymGEO’s technical help, DDOT now has improved internal communication and decision-making abilities. The training provided by SymGEO has been super beneficial – they are a treasure!”

– DDOT Program Manager, Traffic Management Center

ArcGIS Hub was used to host the solution as it facilitated the understanding and workflow of how each individual component fits into the comprehensive picture.

The solution is built around a core data set of special events. Individual events are initially “registered” with the solution using an ArcGIS Survey123 intake form.
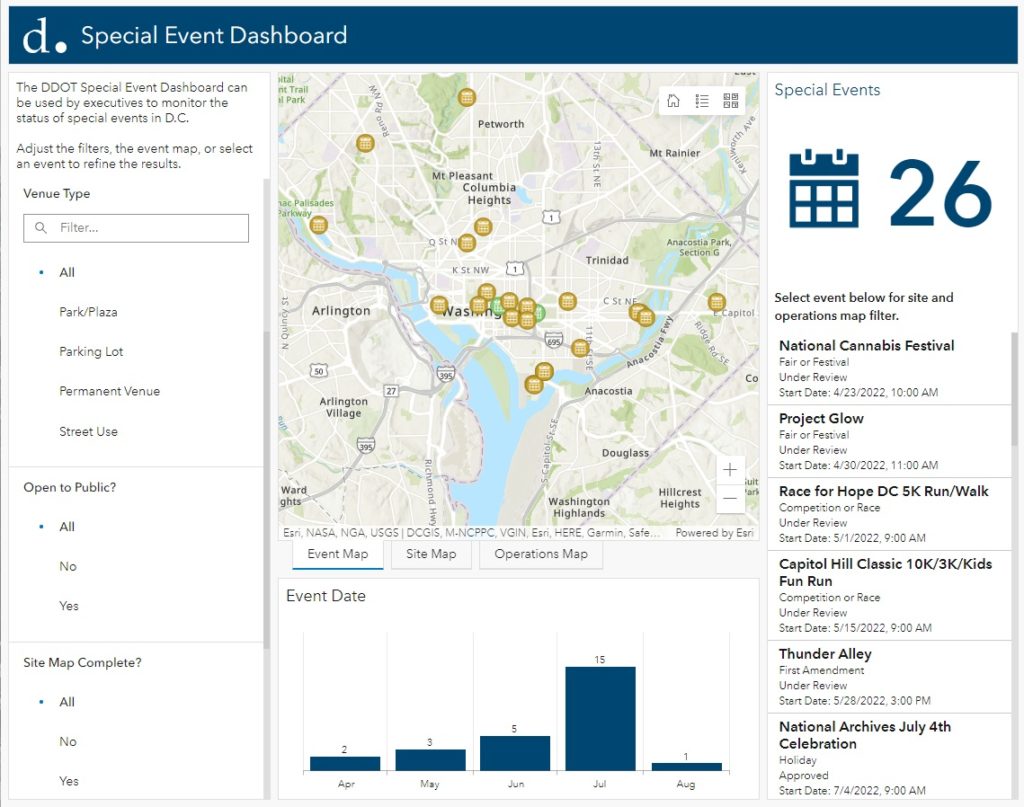
An ArcGIS Dashboard uses the event information to give managers an overview of upcoming (or past) events that can be filtered by venue type, expected crowd size, approval status, or other event characteristics.

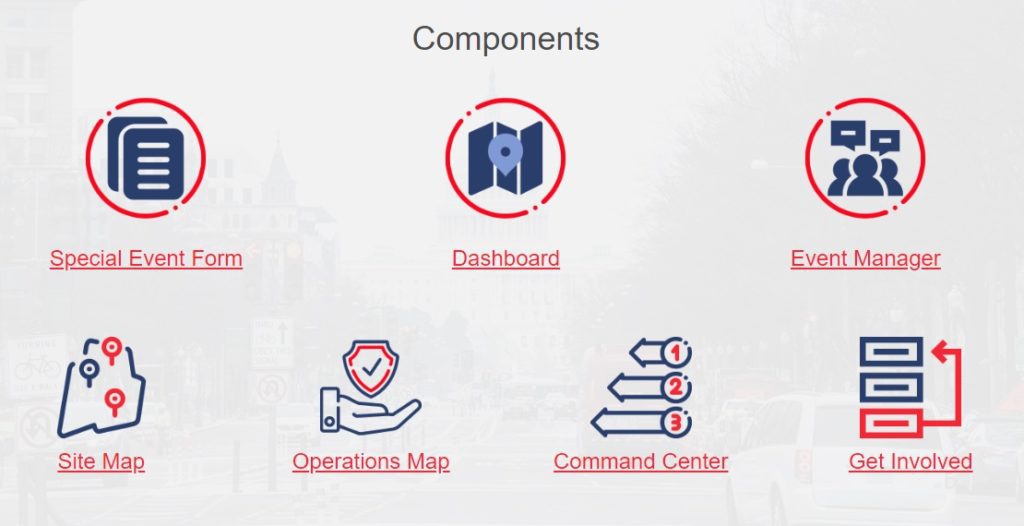
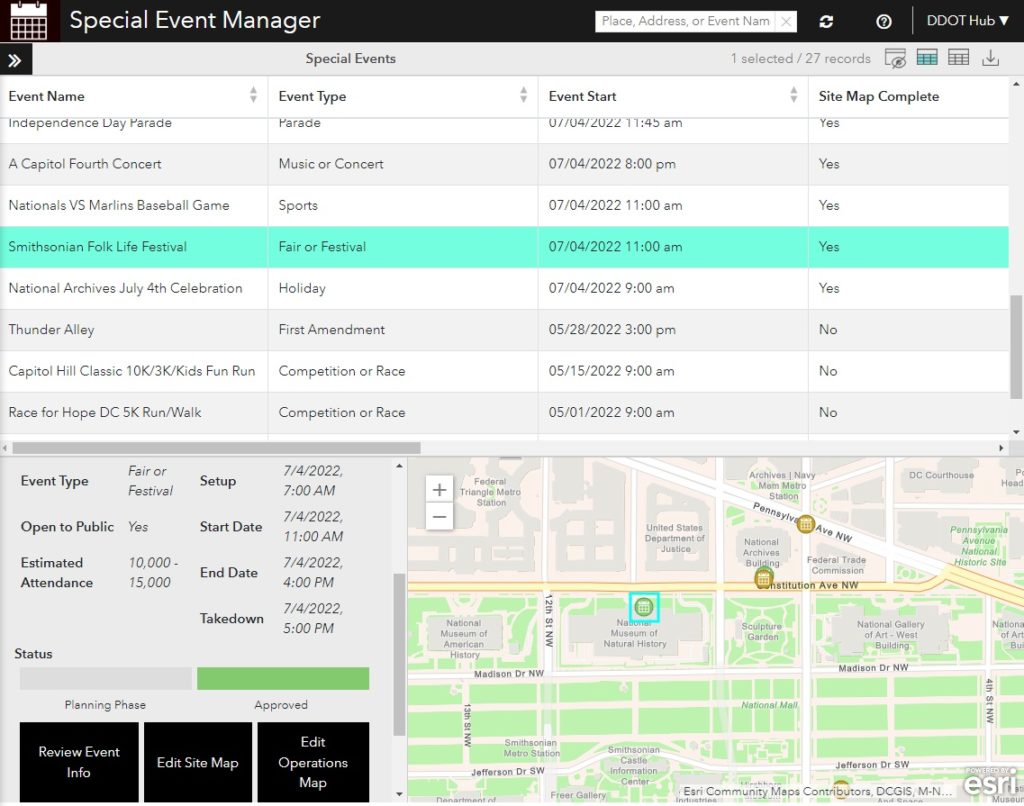
The Special Event Manager is used to dive deep into specific events. From this interface, site maps or operation maps can be created, copied from past events, reviewed, and eventually approved.
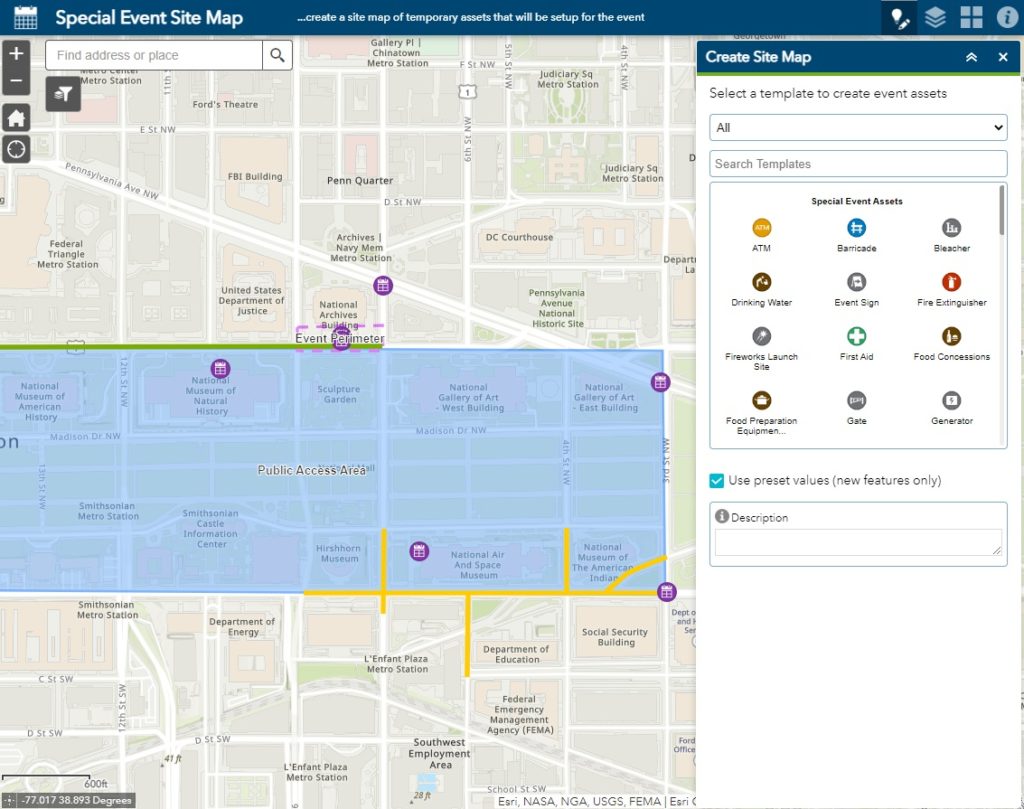
The Special Event Site Map interface facilitates the creation of site maps linked to individual events. Site maps include the point, line, or area representation of event physical features. This may include signs, fire lanes, event perimeters, or other stationary event components.
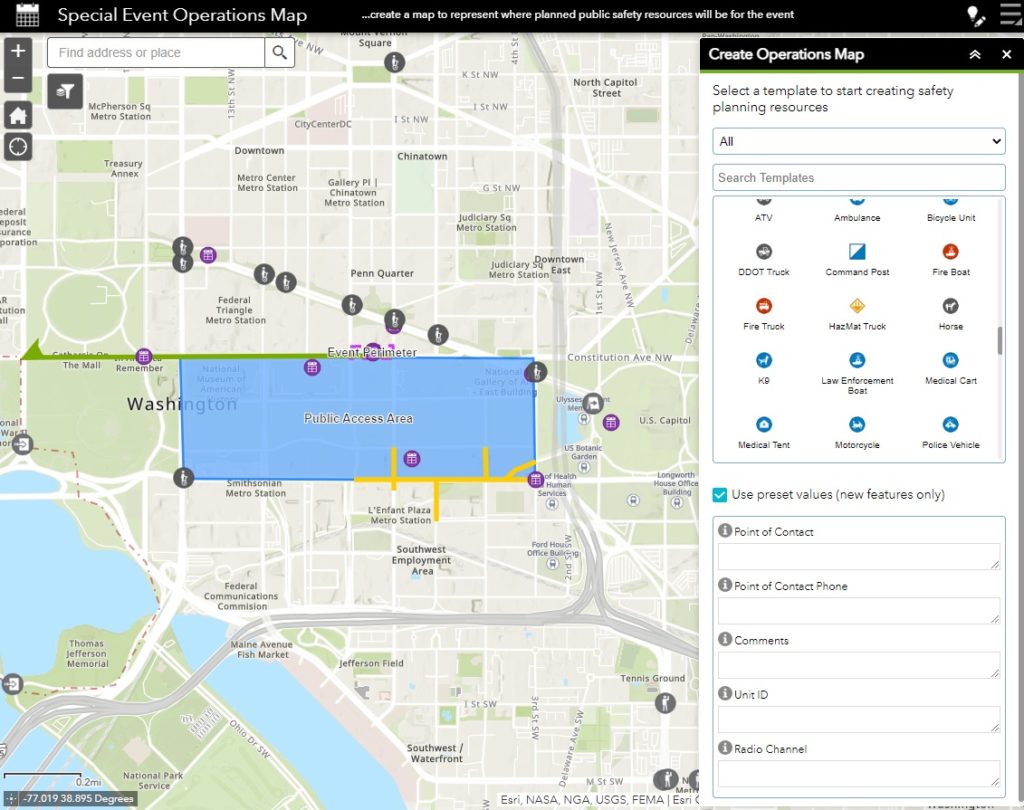
The operations map includes mobile or distributed resources that will be actively deployed during the event. This may include trucks, traffic control officers, resource assignment paths, staging areas, or security perimeters.

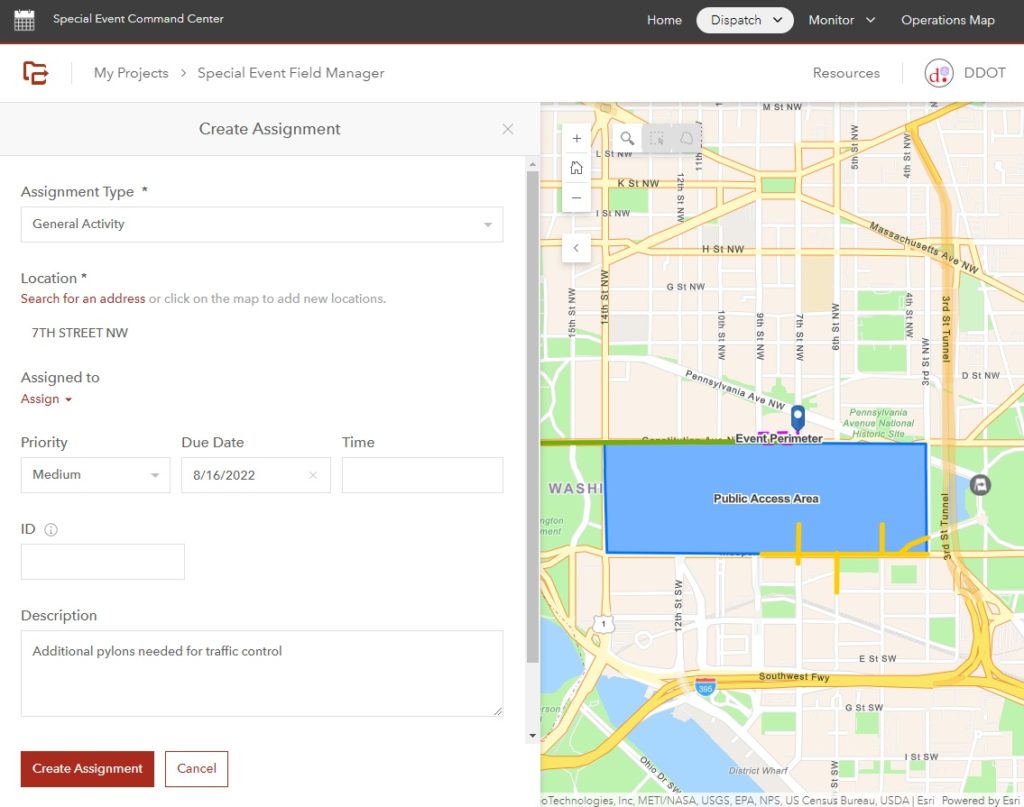
During an event, assignments can be created and assigned from the Special Event Command Center. Assignment deployment, tracking, and in-the-field responses are managed using ArcGIS Workforce behind the scenes.

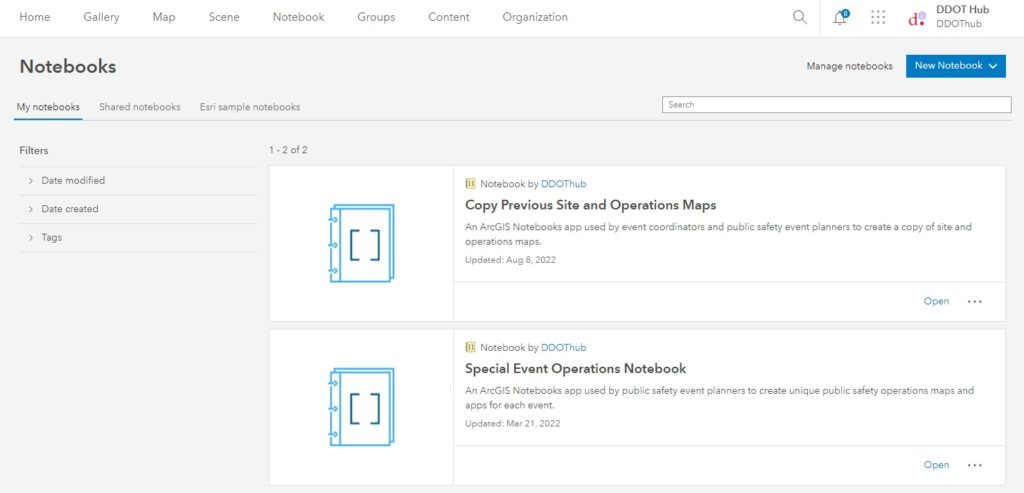
ArcGIS Notebooks are used to copy site plans and operations maps from previous events. This saves time, money, and the duplication of effort for annual or repeating events.

Talk to SymGEO today if your agency or organization is interested in managing special events using the power of Esri’s Special Event Operations solution – we are certified experts and here to help.

Capital Projects Dashboard

The District Department of Transportation (DDOT) manages millions of dollars’ worth of capital projects on an annual basis. To facilitate the communication of budget and schedule status, SymGEO helped configure a Capital Projects Dashboard solution for internal use, powered by ArcGIS Dashboards technology.

“This is so good! I love it and it is a game-changer. I am really impressed and could not be more thankful for this. This is a great tool for the agency to get things straight in the system and then use it as a tool for tracking.”

– DDOT Chief Performance Officer

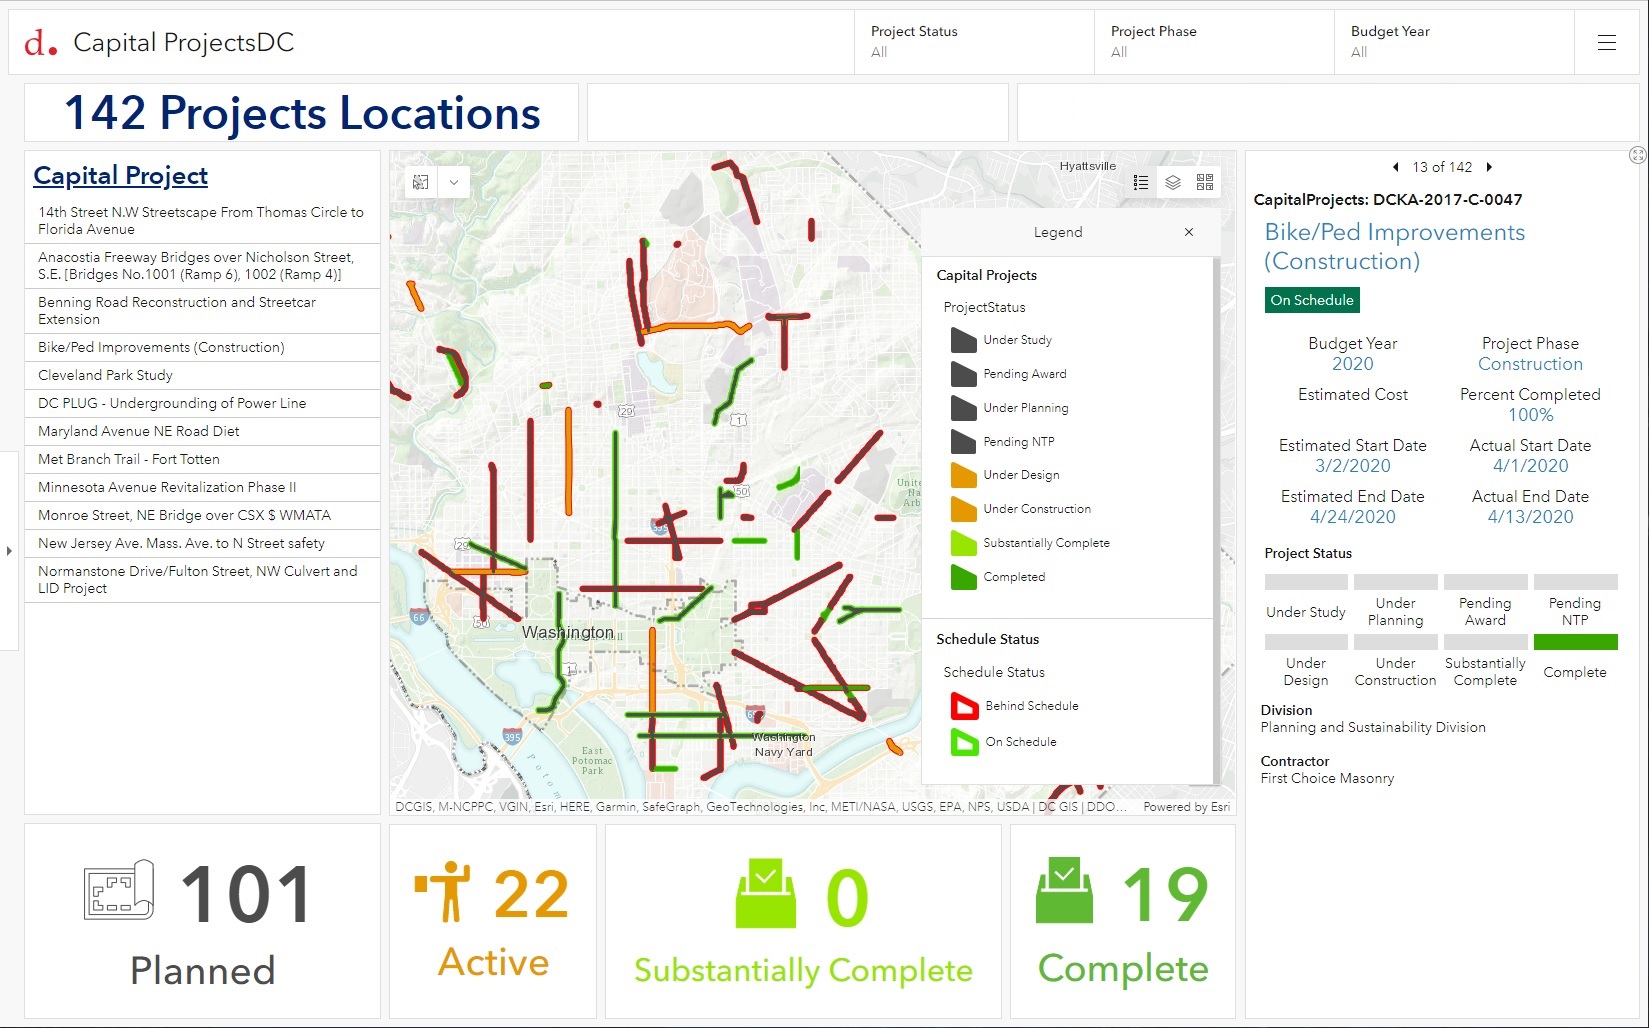
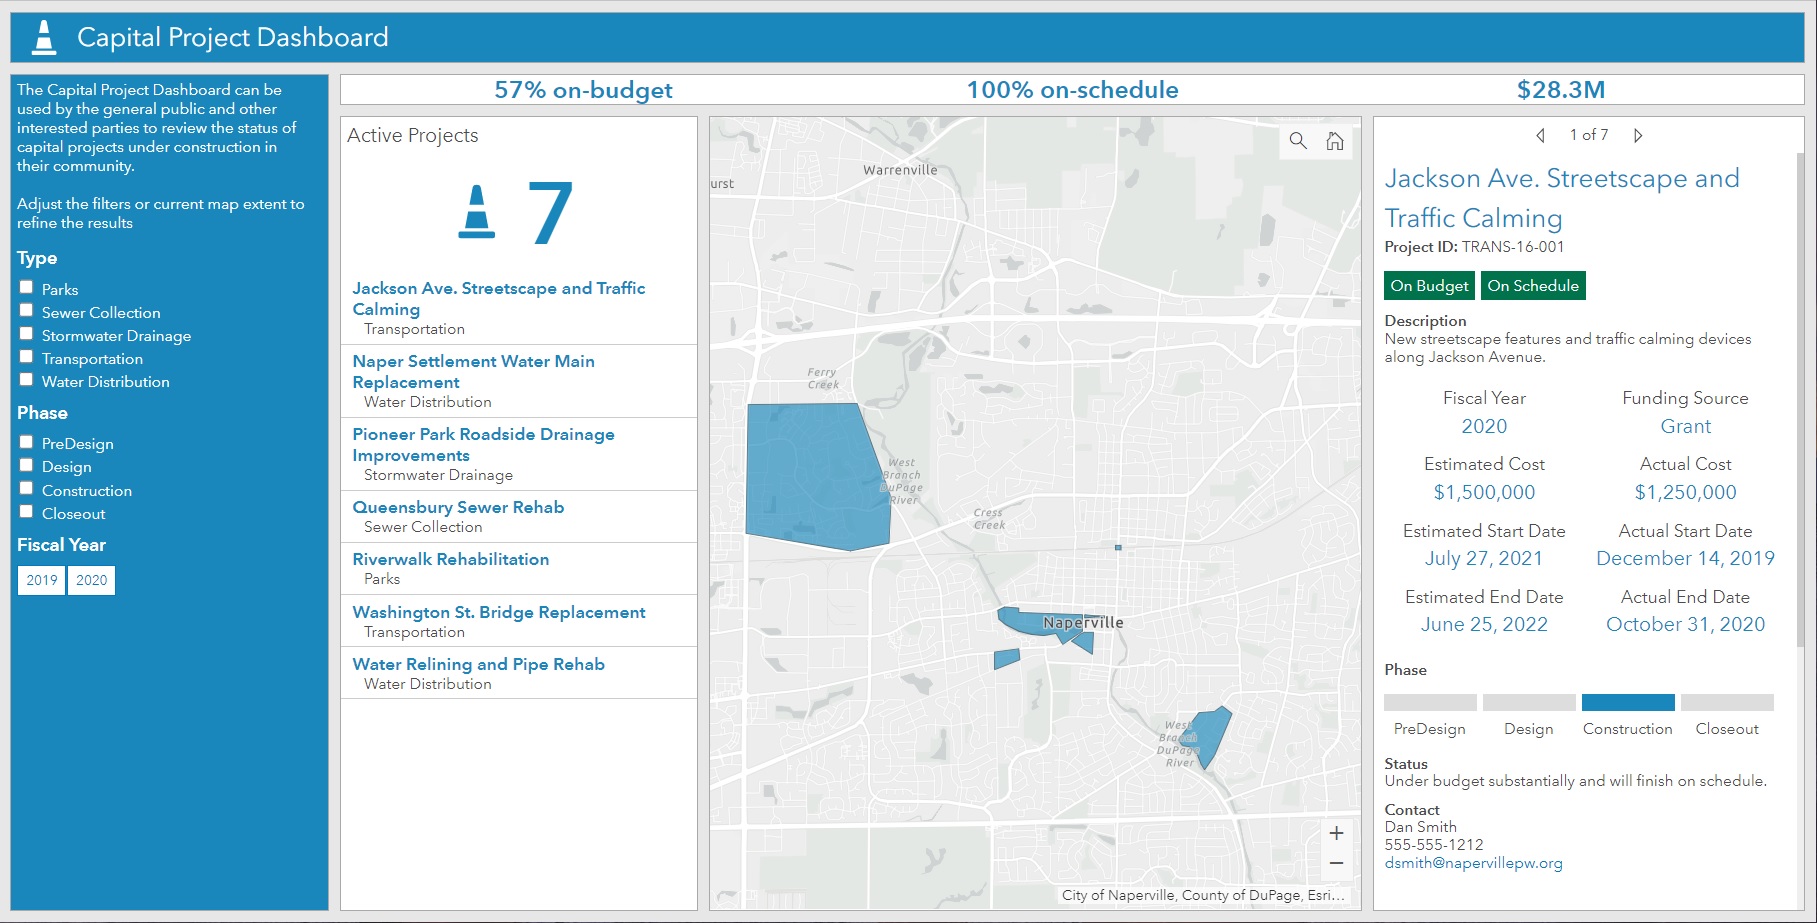
The configured solution builds on an Esri-provided template (below) and provides insight by budget year, construction status, and project phase. Summary statistics are provided as numerical indicators, and map symbology is used to visually communicate project status. The Arcade expressions, used to determine project status, were configured to fit DDOT’s capital project data schema using data provided by DDOT’s internal project management system.

capital projects dashboard template

Talk to SymGEO today if your agency or organization is interested in managing capital projects using the power of Esri’s Capital Project Dashboard solution – we are certified experts and here to help.

Local Government Solution: Citizen Problem Reporter

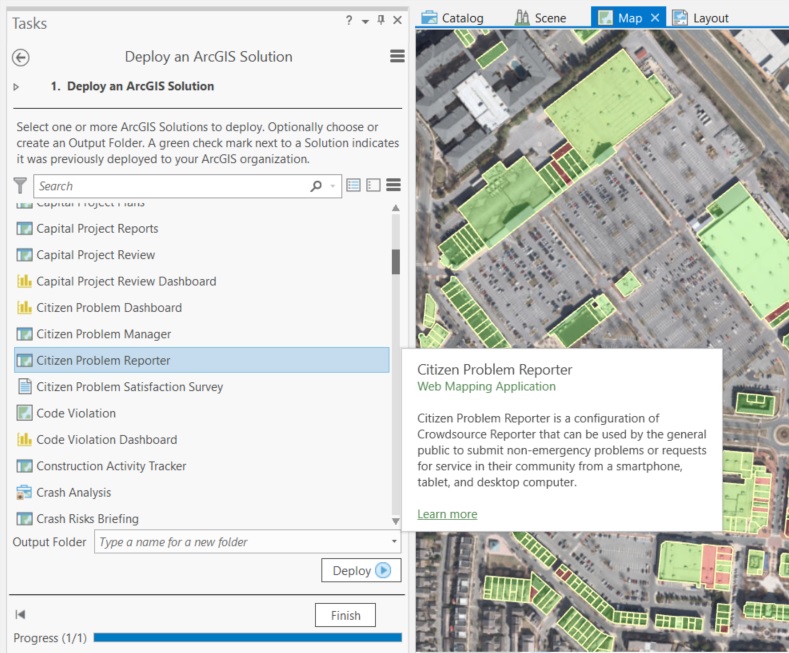
How great would it be to have a solution already developed for you and only some configuration is needed to roll it out? Today we look at the “Citizen Problem Reporter” solution developed by Esri to address a reoccurring need in local government.

Every local government has access to real-time, mobile sensors that travel throughout their jurisdiction on a daily basis. You guessed it, their citizens are their sensors! People notice issues left, right, and center. When armed with the right tools, people can be the eyes and ears of the community, giving near-instant notification of any concerns. These may range from dangers such as downed power-lines, or trash that wasn’t collected, or graffiti, or… the list goes on!

To help get the solution jump-started, Esri has developed a set of data and applications that fit together into a government’s ArcGIS online account.

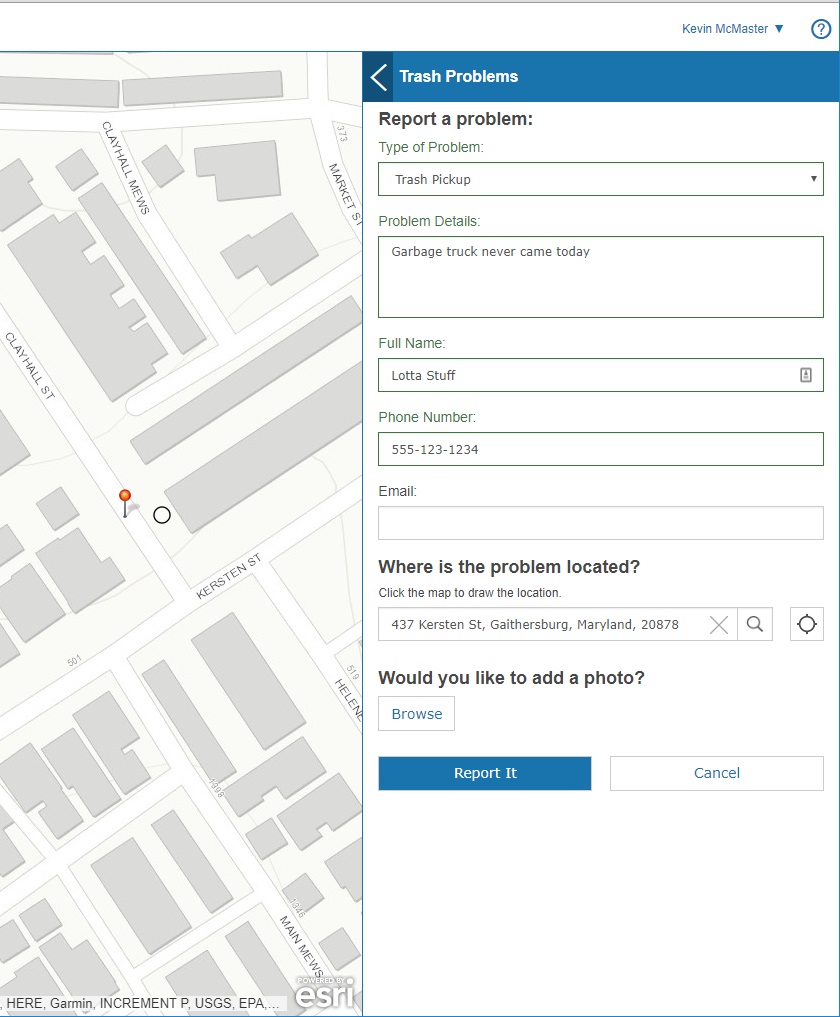
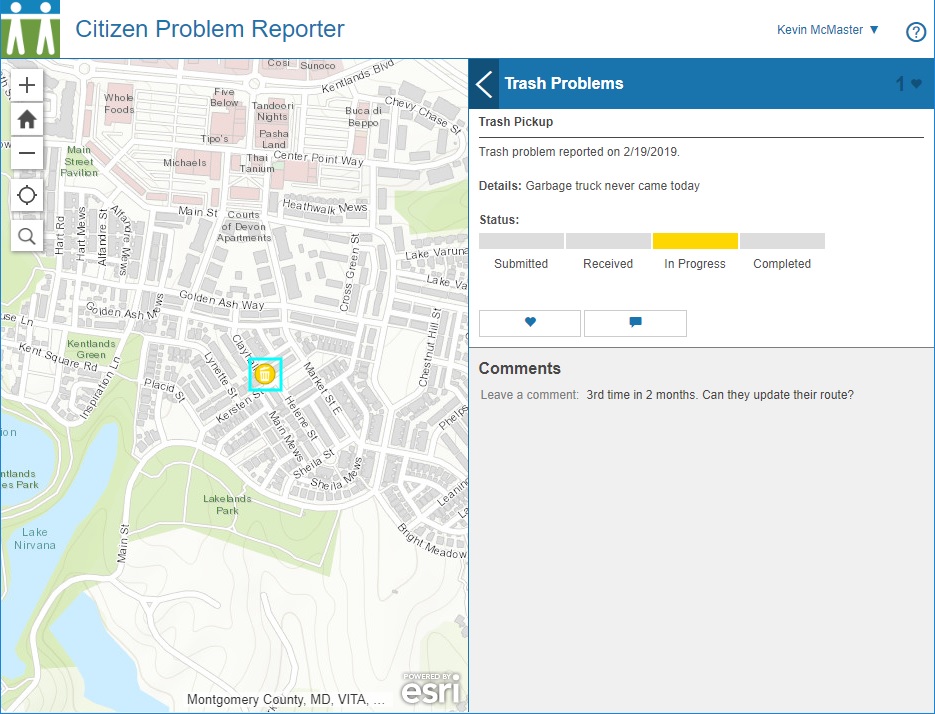
The solution includes an application that a citizen uses to report a problem through a fully mobile-responsive web interface. Great for easy access on the go!

citizen reporter application

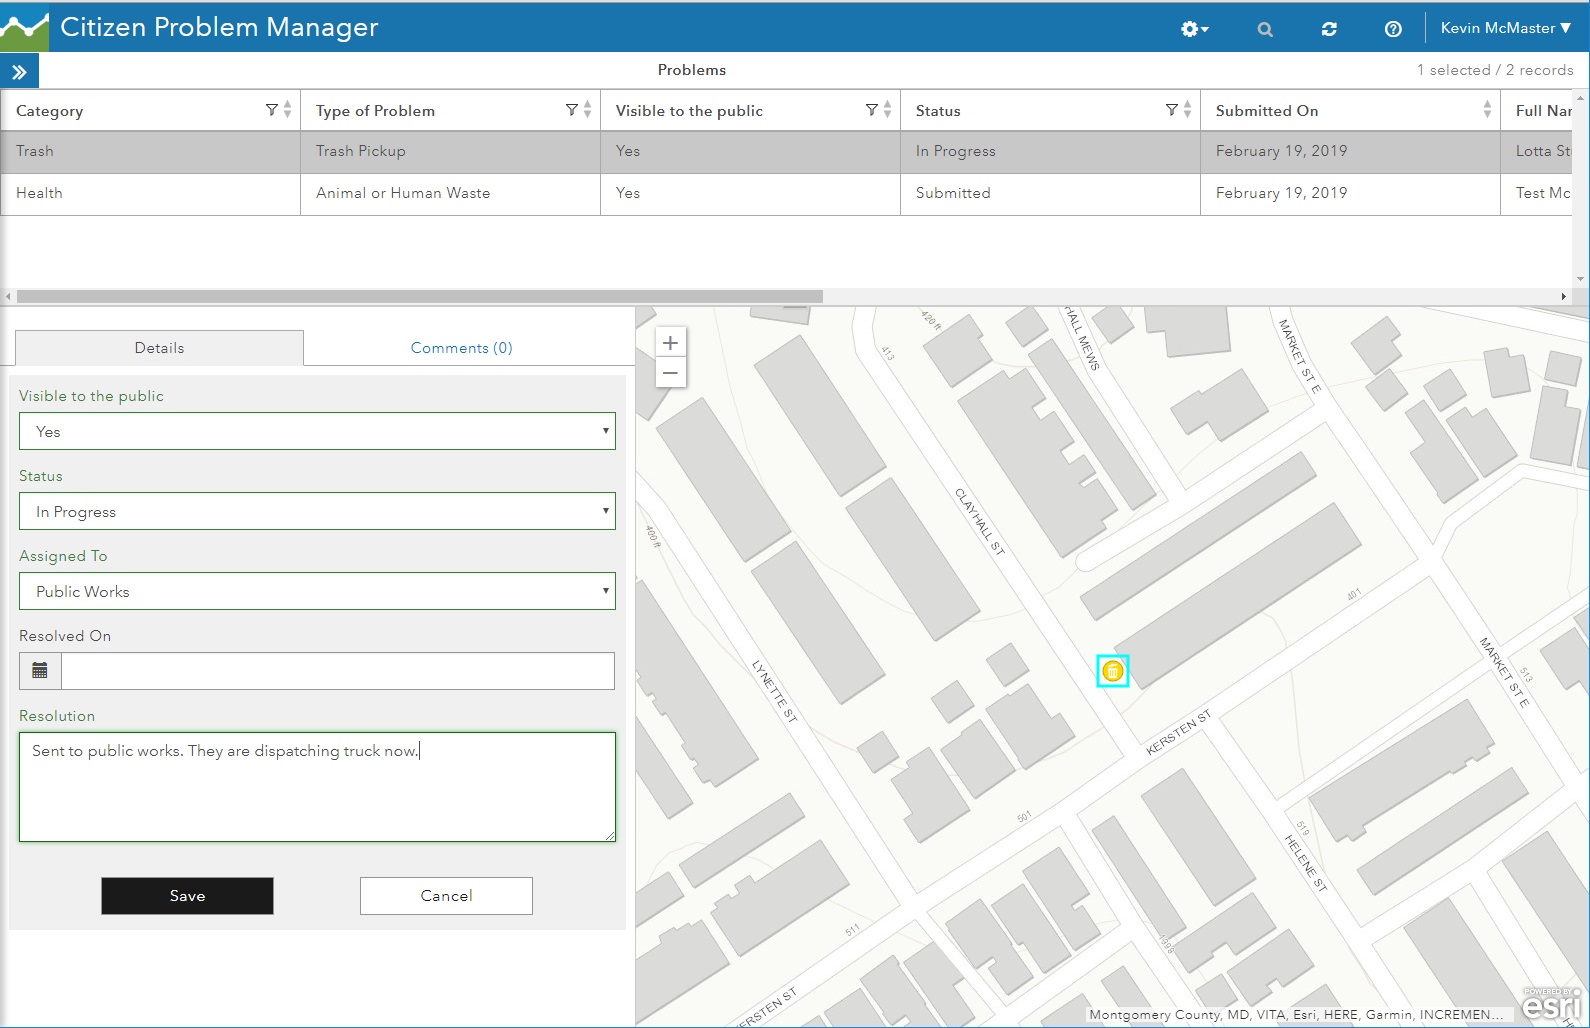
Once reported, the citizen problem manager sees all the issues using a separate application. They will route the issue to the appropriate department, add notes, and update the resolution status.

citizen problem manager

Citizens see the status of all issues through their application and know that they are being addressed. People can add notes, “up-vote” an issue, and make it into a social media platform if desired.

citizen problem reporter social

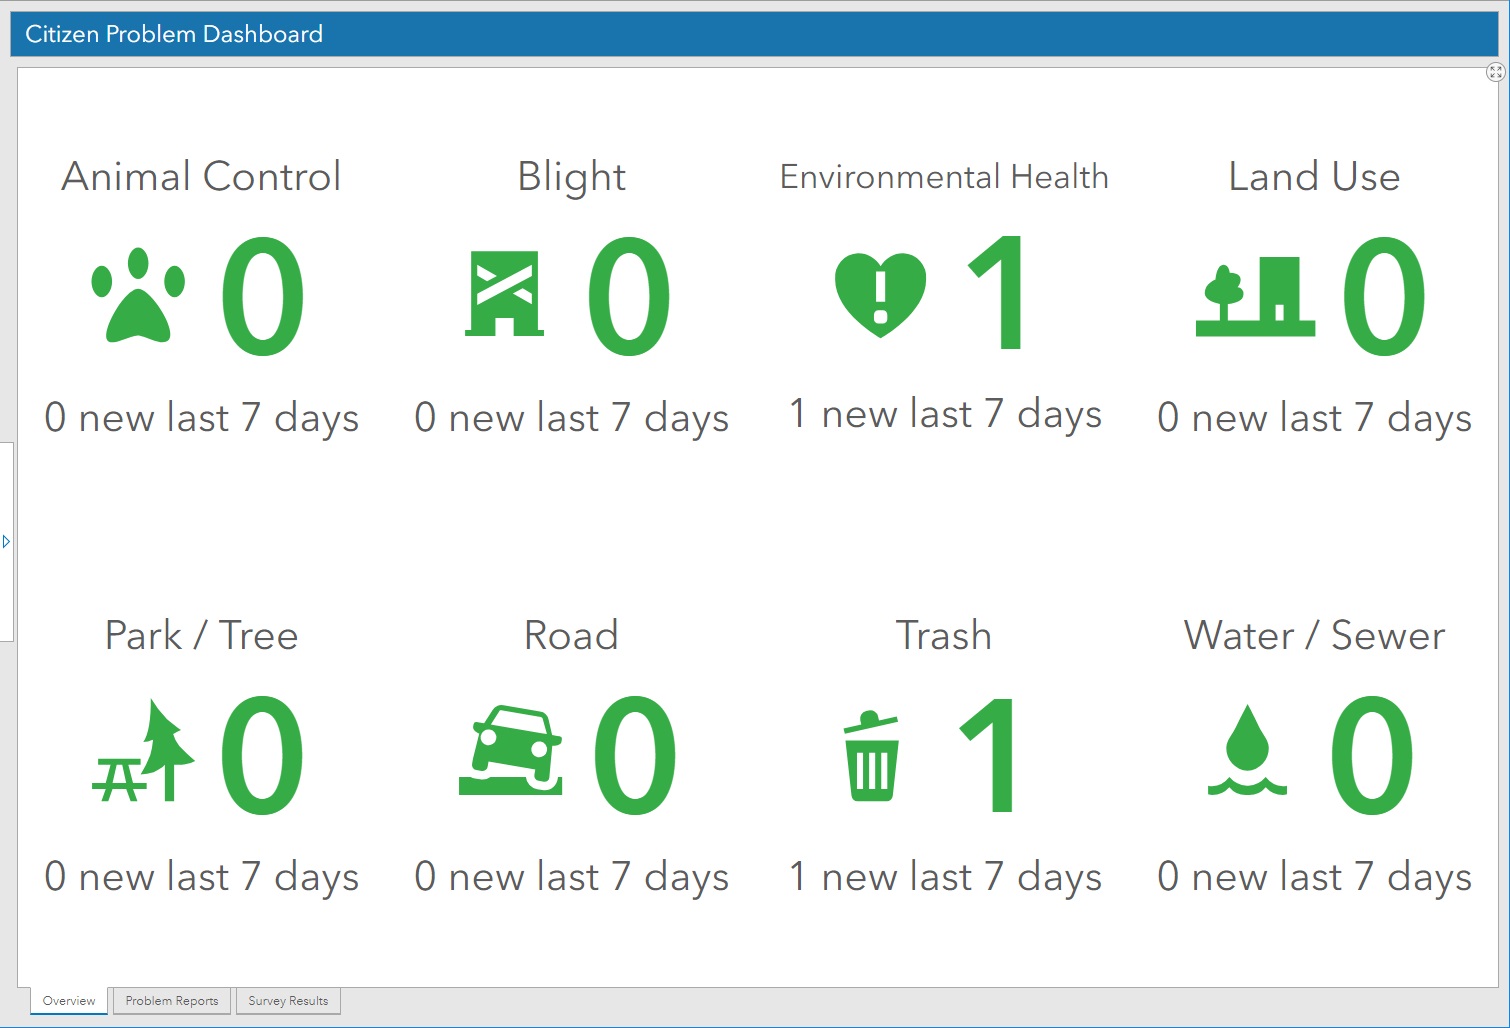
On the manager side, a dashboard keeps track of all issues that have been recently submitted. This helps to spot trends and identify departments that may need extra resources to address the needs.

issue dashboard

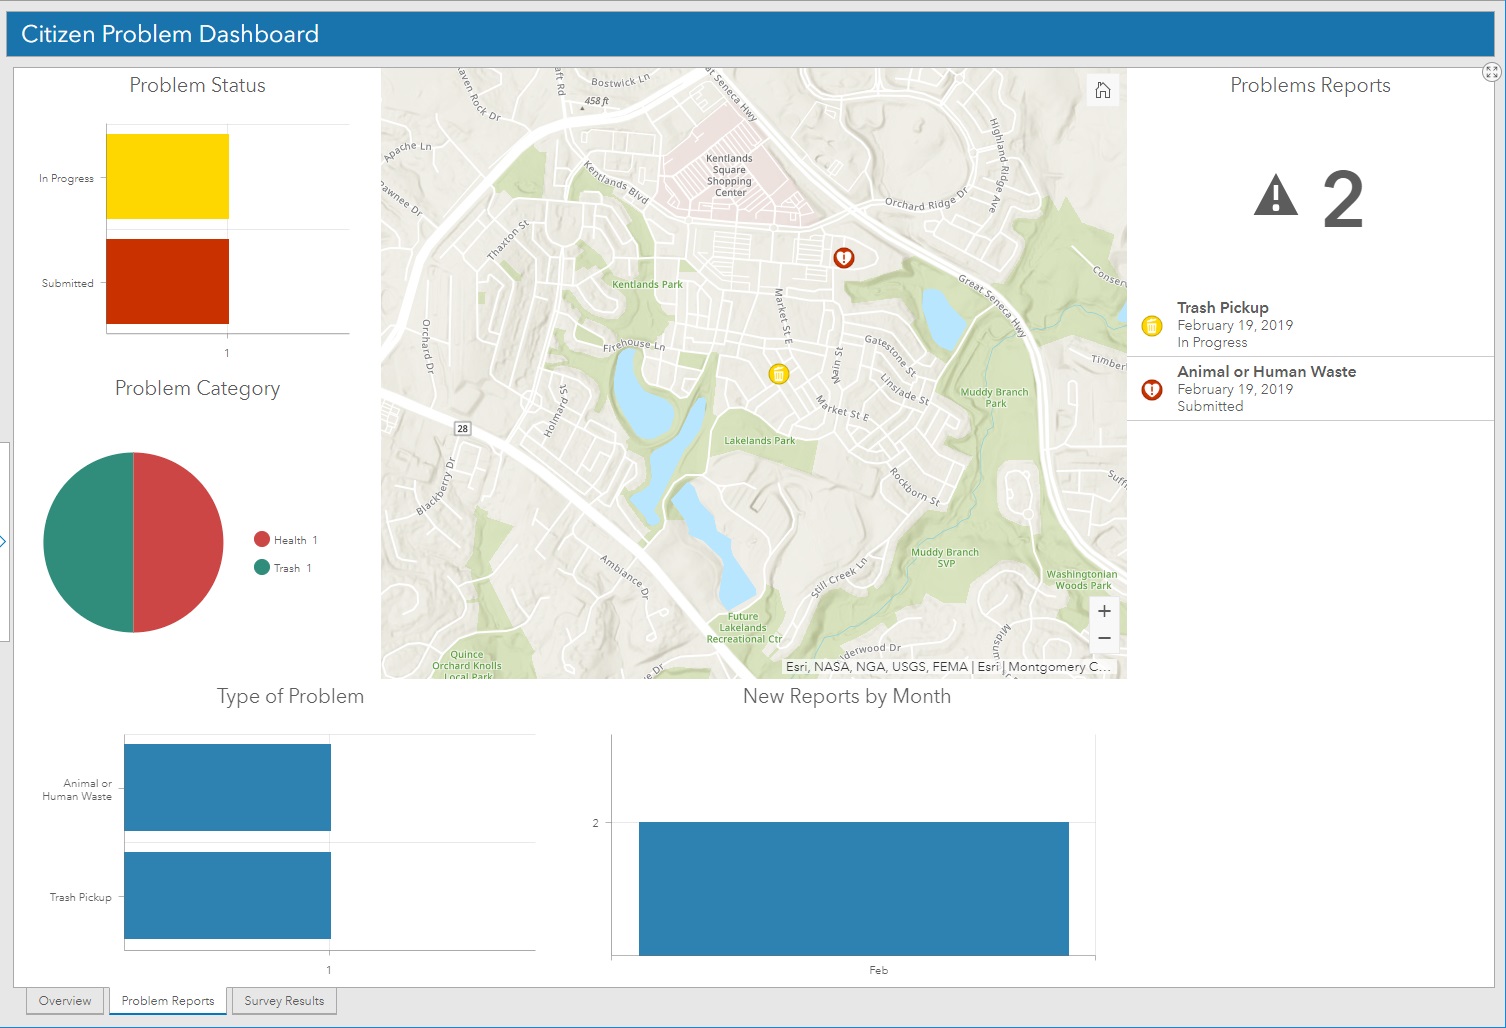
A statistical component of the dashboard keeps track of the requests over time and displays the status of all requests.

issue dashboard status

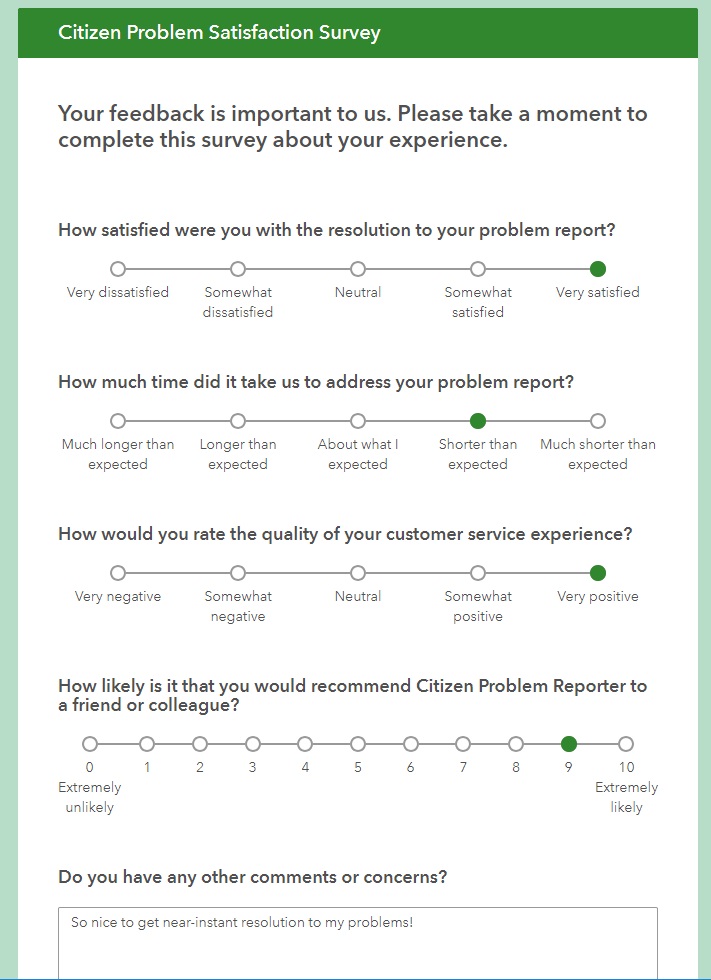
Optionally, a survey can be sent to the citizen who reported the issue to help close the loop and keep them engaged with the process.

reporter survey

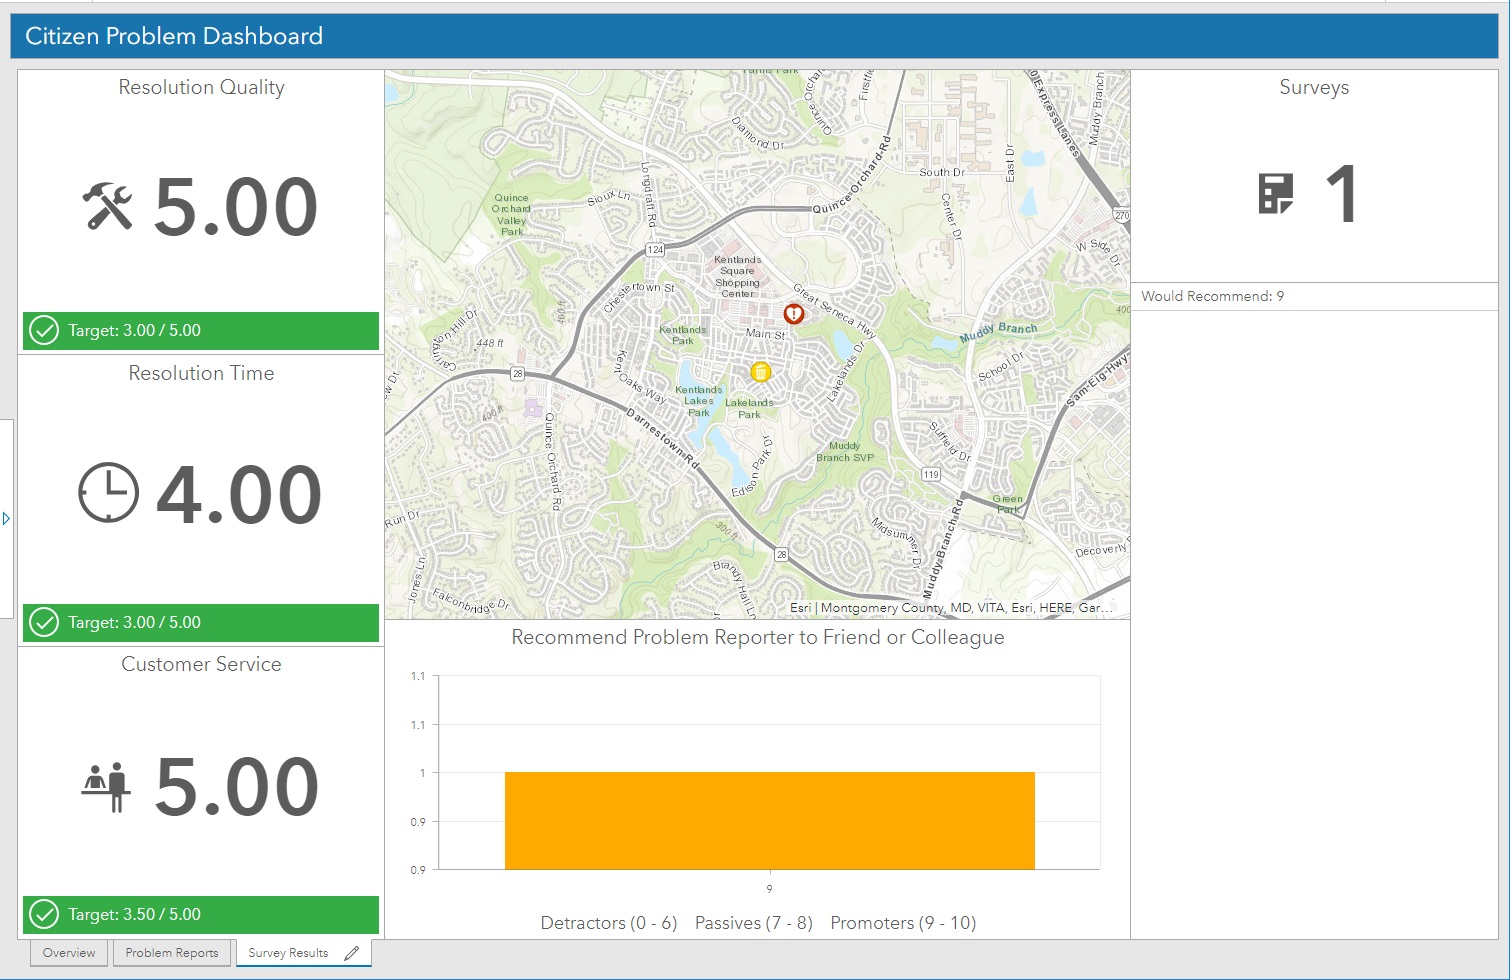
Finally, the manager dashboard also keeps track of survey responses. This is helpful to view perceived responsiveness of the department and show where improvement may be needed.

reporter survey dashboard

This local government solution is just one of many that have been pre-assembled and tested by Esri professional staff.

If you’d like help deploying this or other Esri Local Government Solutions, let SymGEO know, as we’re here to help!


Croatian Rail Network

SymGEO is pleased to announce the completion of a project with The World Bank Group that enables valuable interactive insight into the rail transportation system in Croatia. This project has since been featured by Esri as a Case Study for dashboard best practices, and then featured in ArcNews as a success story entitled “World Bank Deploys GIS Dashboard to Improve Railway Safety in Croatia“.

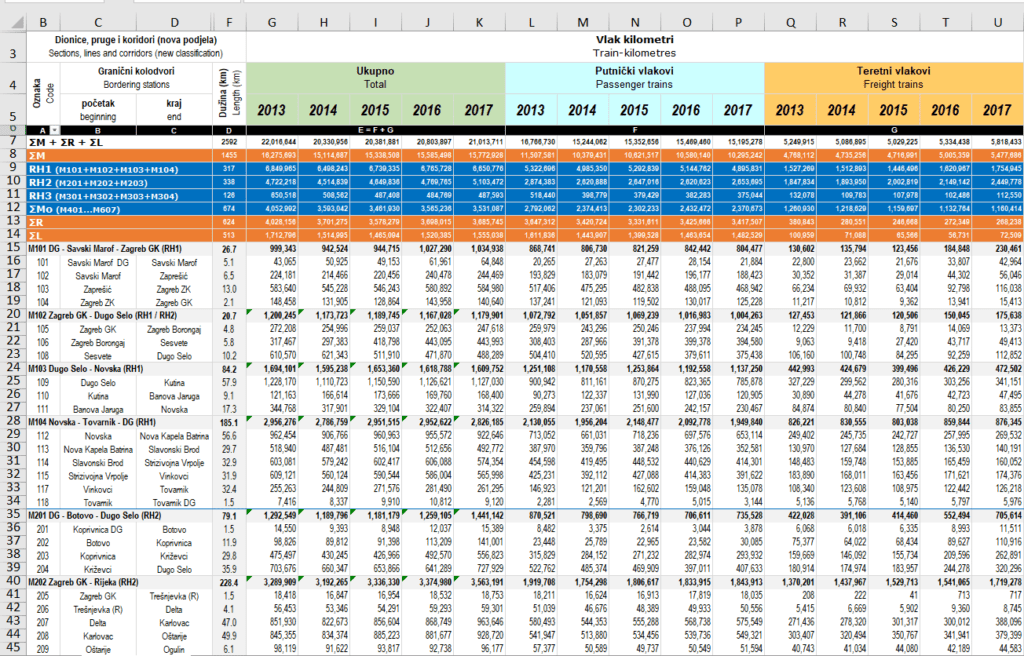
This project started from humble beginnings, with a series of excel files that detailed rail segment speed, passenger numbers, freight volumes, age of the track, and other characteristics.

croatia excel file

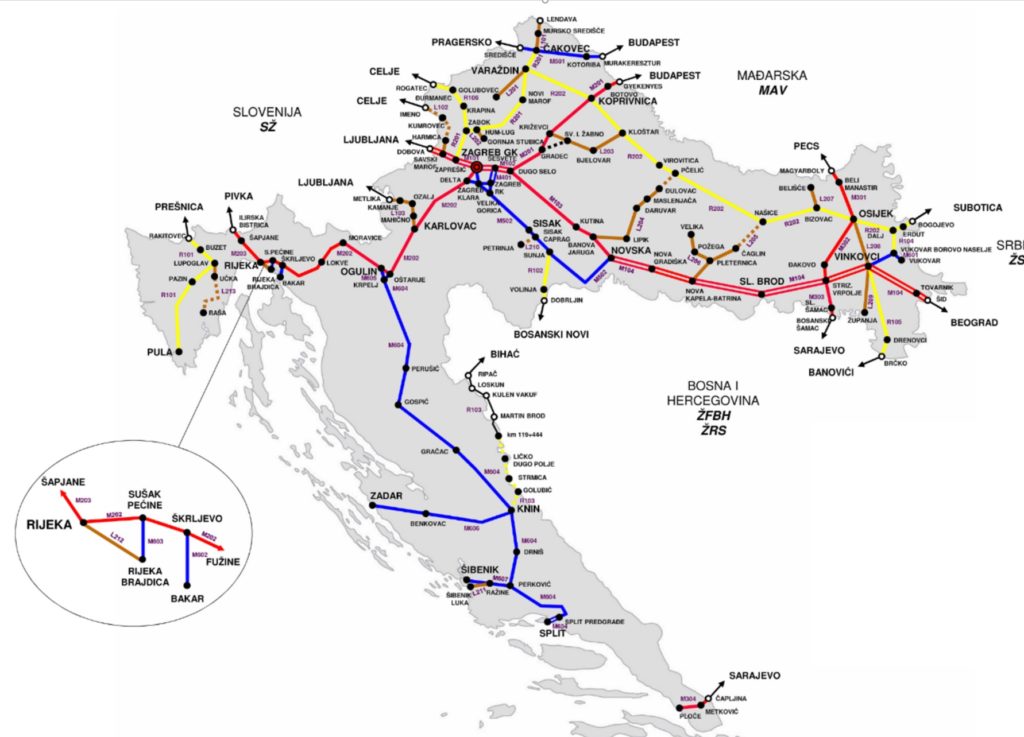
SymGEO then used a schematic diagram of the network to build and calibrate a spatially accurate network based on OpenStreetMap rail data and linear referencing of station locations.

croatia network diagram

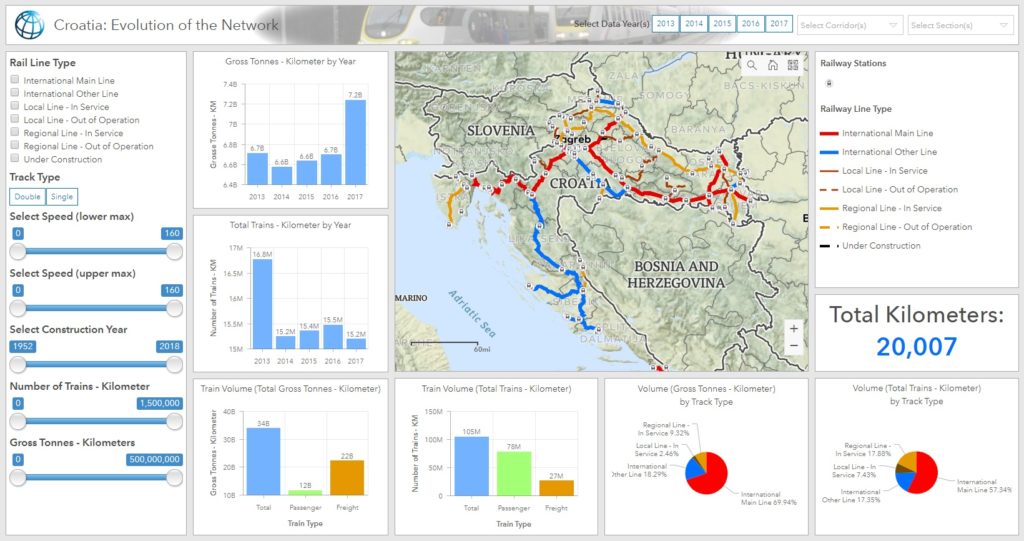
This newly created spatial data was then hosted in ArcGIS Online and used to configure an ArcGIS Dashboard application. This application was specifically designed to filter and query the data interactively on demand and present summary statistics based on complex queries. This combination of attribute queries, summary statistics, and visual representation now enables report graphics and key decision data to be created on-the-fly by the client.

“This is superb and exactly what the client needed and what I was imagining.”

– World Bank client

If you have complex transportation network data that you’d like to leverage with an intuitive, user-friendly, configurable application, then SymGEO would love to hear from you!

Land Area by Zoning

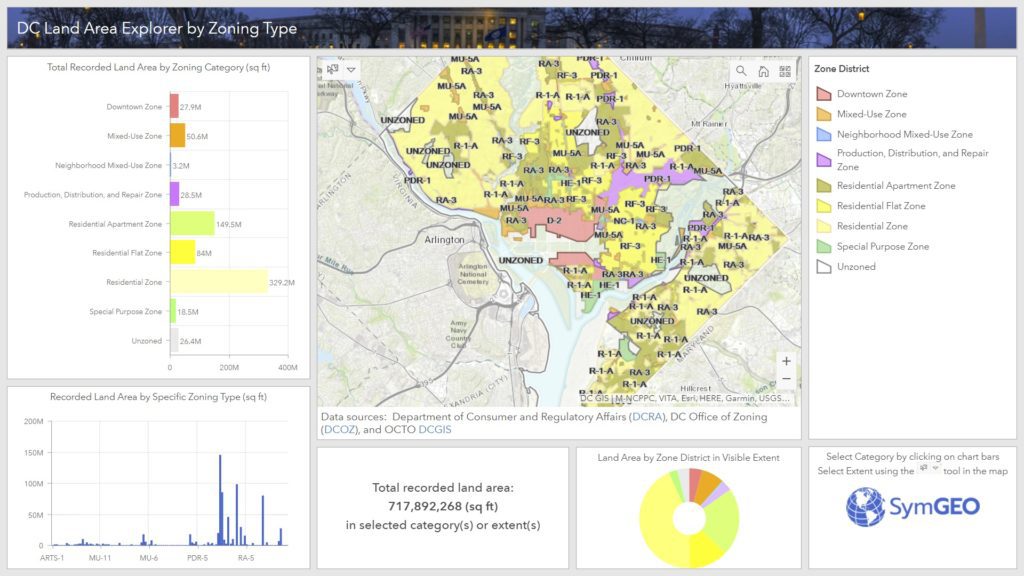
Ever wonder how much land area there is in DC by zoning district or specific zone? Well, wonder no more, as we sliced and diced the data, and created the DC Land Area Explorer by Zoning Type. This application leverages Esri‘s select by chart category functionality in ArcGIS dashboard. Data is kindly provided by our friends at DC Office of Zoning (DCOZ),  the Department of Consumer and Regulatory Affairs (DCRA), and a fabulous basemap by OCTO’s DCGIS team.

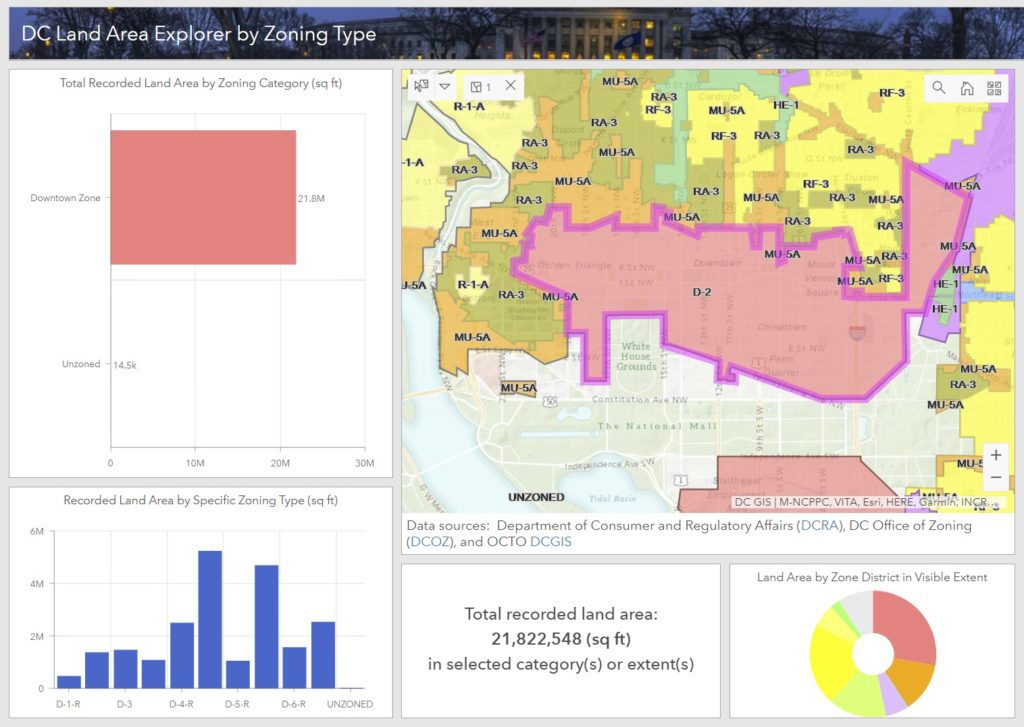
Users can select zoning categories or specific zones by clicking on the bars in the charts. This will update the total recorded land area calculation to just the selected zone(s). Alternatively, for really detailed analysis, zooming into the map and using the “select” tool in the map window allows the selection by zoning district, specific zone, or even property boundaries.

Take a look at the DC Land Area Explorer by Zoning Type, and if you have data you’d like sliced, diced, sauteed or… you know who to contact!

Waze Traffic in DC

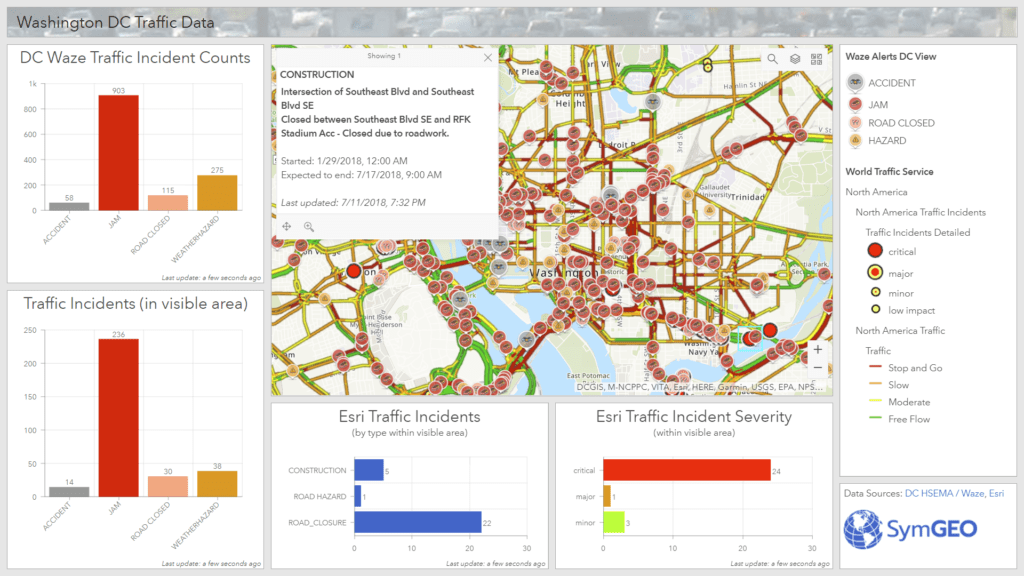
Waze and Esri recently announced an expanded partnership, giving cities easier access to traffic conditions data and incident reports. Esri also has a traffic layer updated every 5 minutes, with road closure notices and other important information included. By combining these near real-time data sources with the marvels of modern technology, SymGEO is pleased to unveil the DC Traffic Dashboard.

Use the DC Traffic Dashboard to plan your commute, see what’s in store, or enjoy your day of telework that much more! Contact SymGEO for more info or for your own handy-dandy dashboard.

Workflow Automation

I admit, I resisted for years. Workflow automation seemed like too much work to set up, and I always argued that my spatial data challenges were mostly one-off unique situations that weren’t conducive to setting up a workflow. Until one recent day I saw the light… and I blame California.

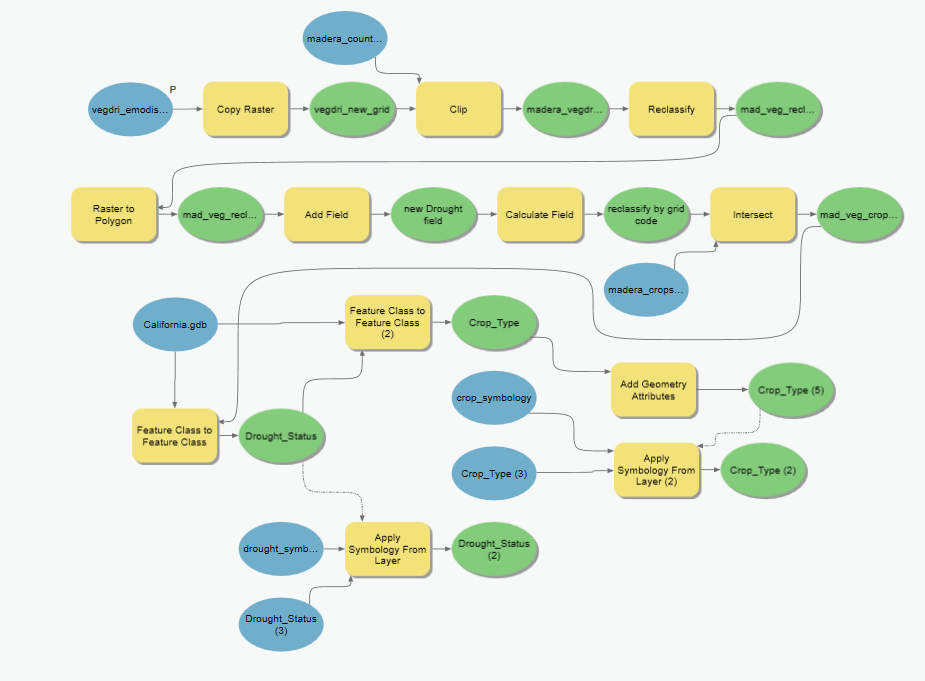
Perhaps you remember our work to incorporate near real-time remote sensing into crop drought monitoring? Well, it turns out that to keep an application like that up to date, the same process is needed time and again, and so the need for data automation was born into the world of SymGEO. Through automation, data layers and attribute fields are always named the same, and features can be over-written without fear of “something breaking” deep within a configurable application. There is also the added benefit of incorporating the usual workarounds that go into regular behind-the-scenes geospatial work such as calculating areas as acreage, or converting grid values into meaningful text. This saves countless hours of frustration and memory searching down the road when trying to repeat a process.

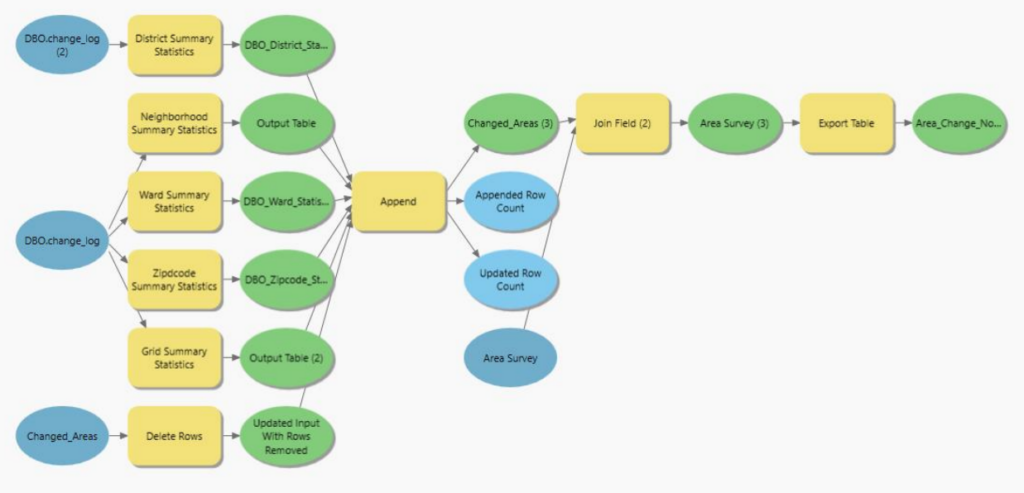
Needless to say, this does cause a model to expand once all the pieces are bolted on, but Esri’s ModelBuilder allows the easy configuration (and re-configuration) of the model until all works as designed.

workflow automation

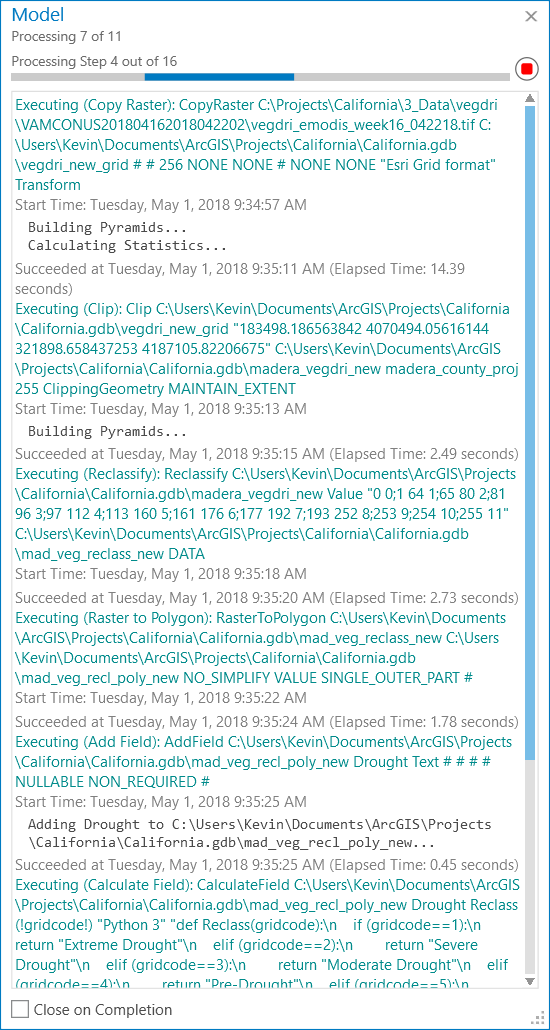
This model has been run many times to make sure all products worked as expected, especially during initial configuration. However, the time savings was considerable with workflow automation given the number of steps involved and the dependency on intermediate layers. In hindsight, it seems to be the finding and configuring of the tools that takes time, not the actual running of the tool.

model processing

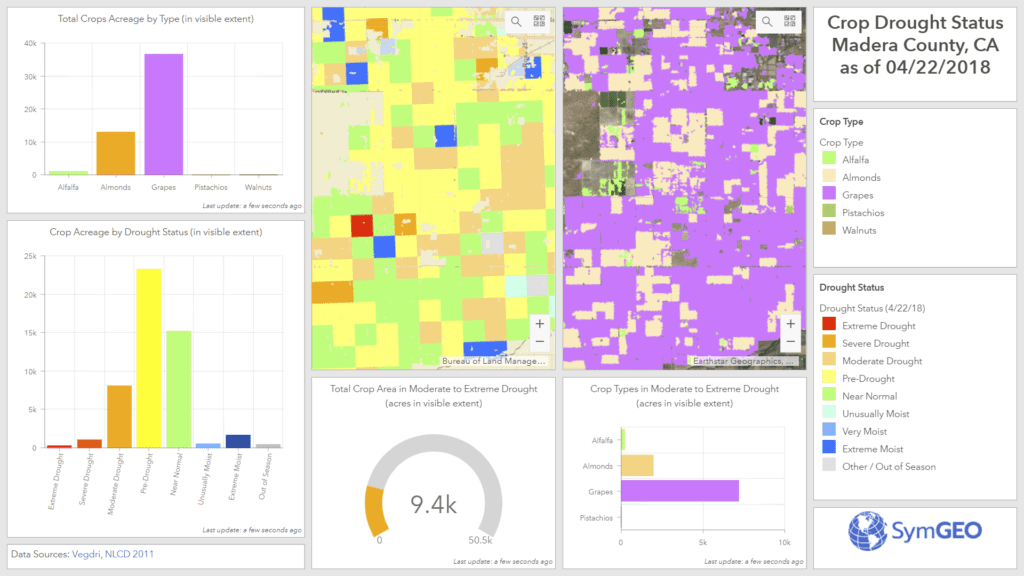
These work products were used to produce and optimize the Crop Drought Status dashboard, which is now ultra-responsive and designed for use at the county-level.

crop drought status dashboard

If you’d like a second pair of eyes on your data workflow, let us know, as SymGEO is ready to automate with ModelBuilder!