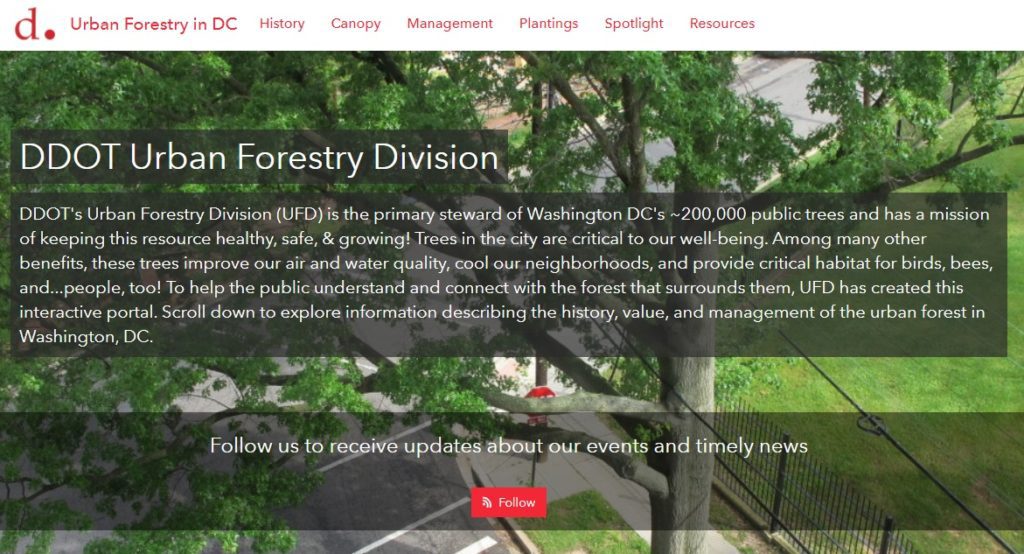
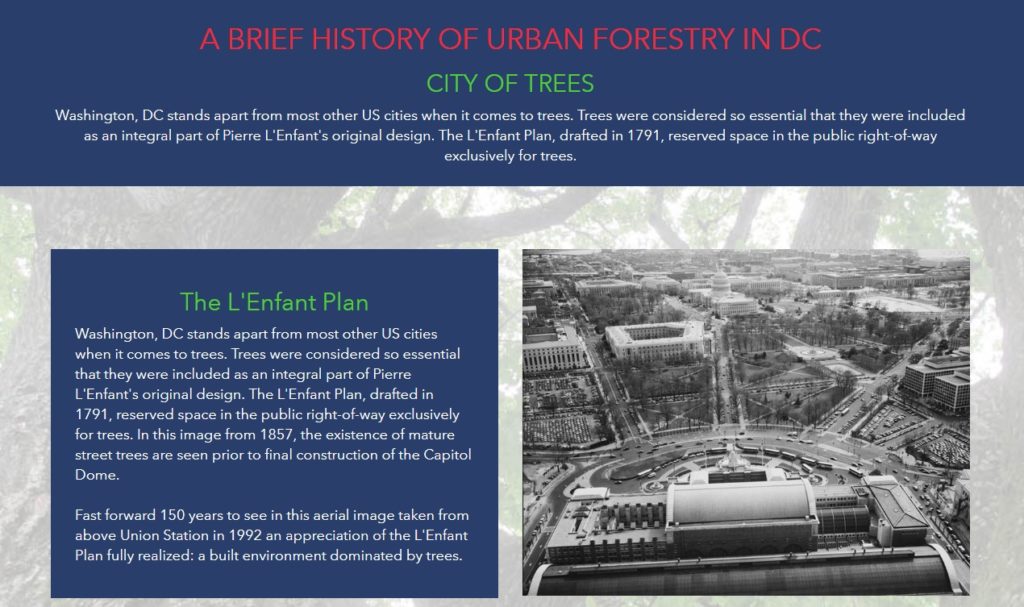
Teaching kids the importance of nature, recycling, history, and culture is a lofty goal. Perhaps it’s a lesson that could be taught from the comfort of a bench constructed from recycled urban wood sourced from a local DC neighborhood rich in cultural history? This is now possible thanks to the District Department of Transportation (DDOT) Urban Forestry Division (UFD)’s new initiative called “Urban Wood Reuse: for Schools“. This partnership with the Office of the State Superintendent of Education (OSSE) will provide DC Public Schools and public charter schools with wood products to improve school grounds at no cost.
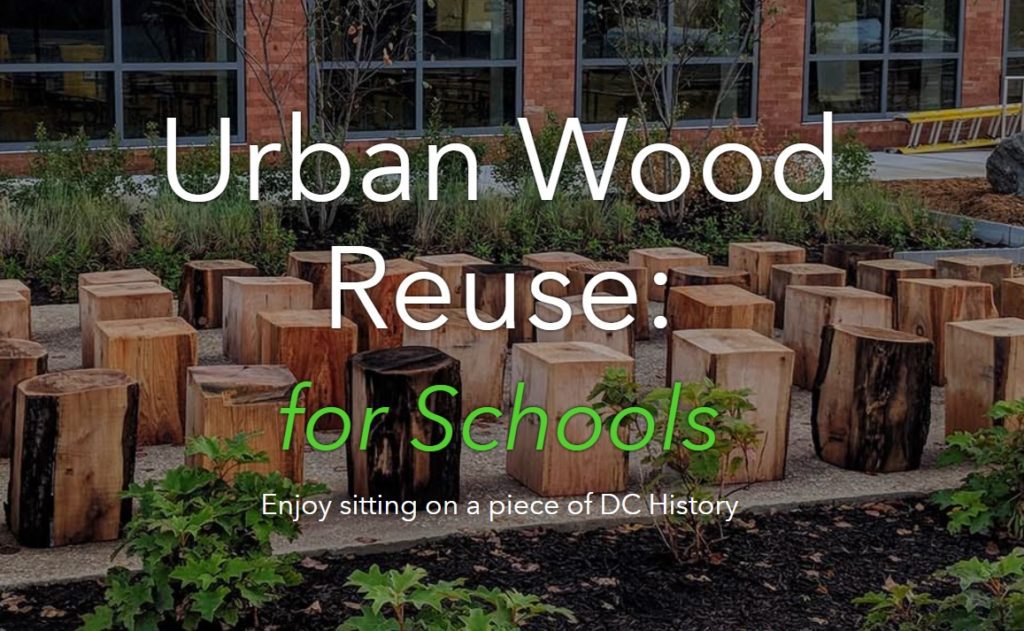
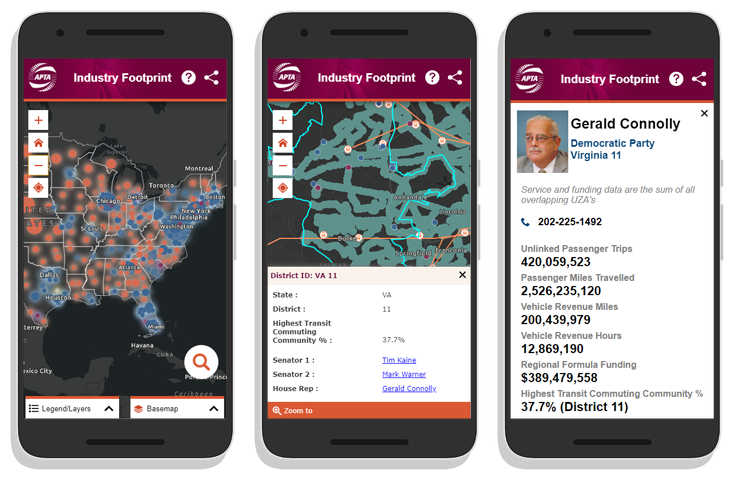
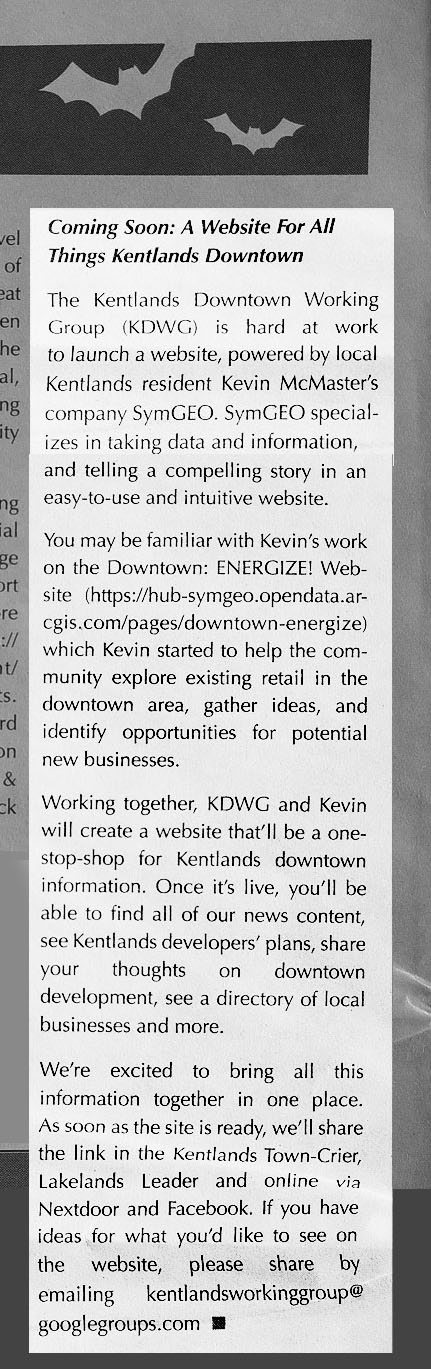
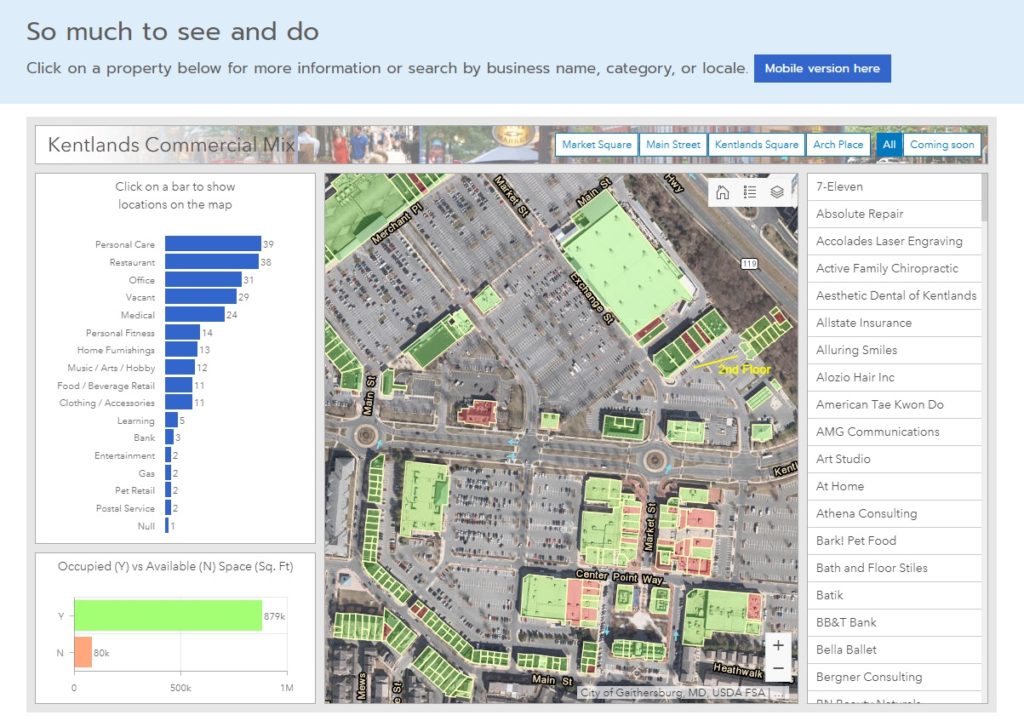
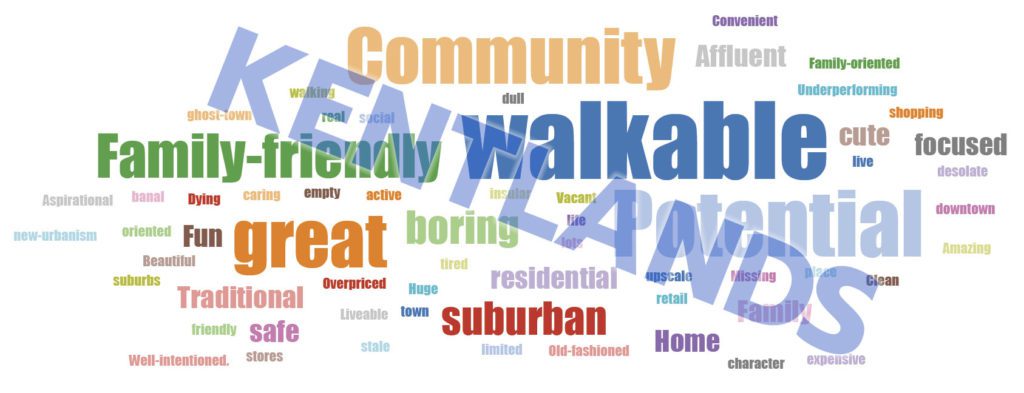
SymGEO was excited to help the Urban Forestry Division (UFD) develop this initiative by using Esri’s ArcGIS Hub technology to establish two-way communication between the UFD and DC schools interested in “sitting on a piece of DC History”. The site shares knowledge and products from the UFD while gathering the school’s product ideas and requirements.
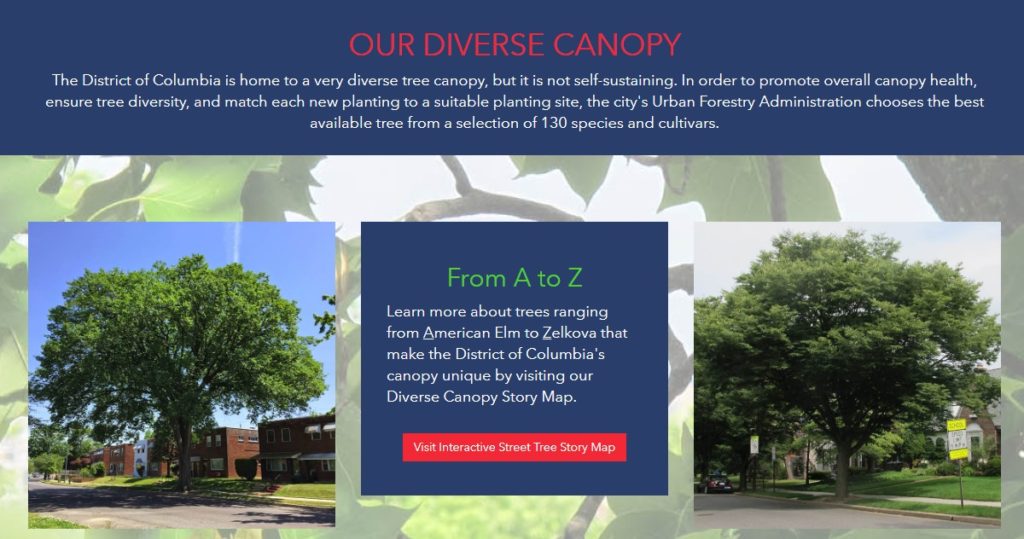
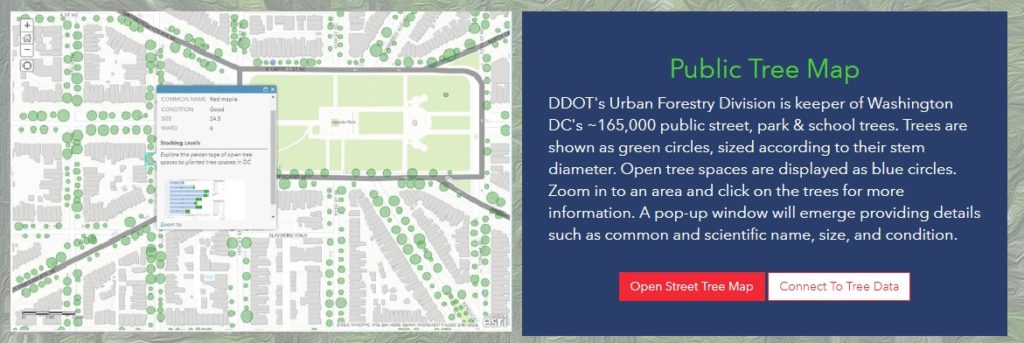
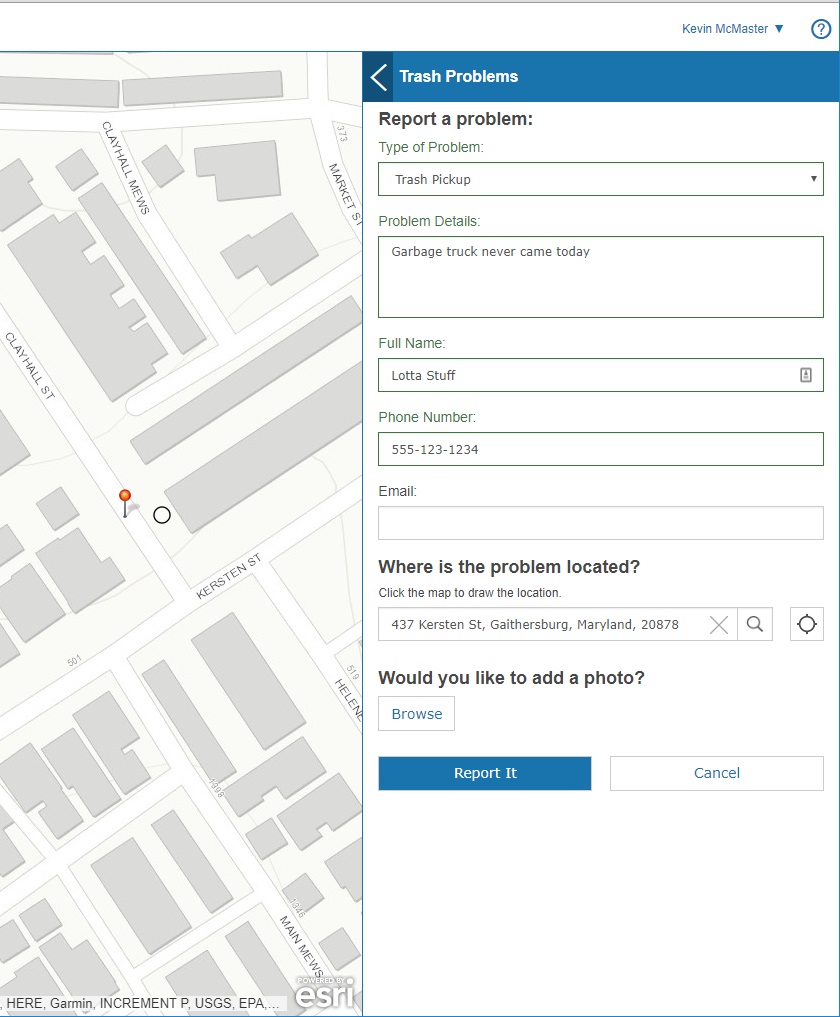
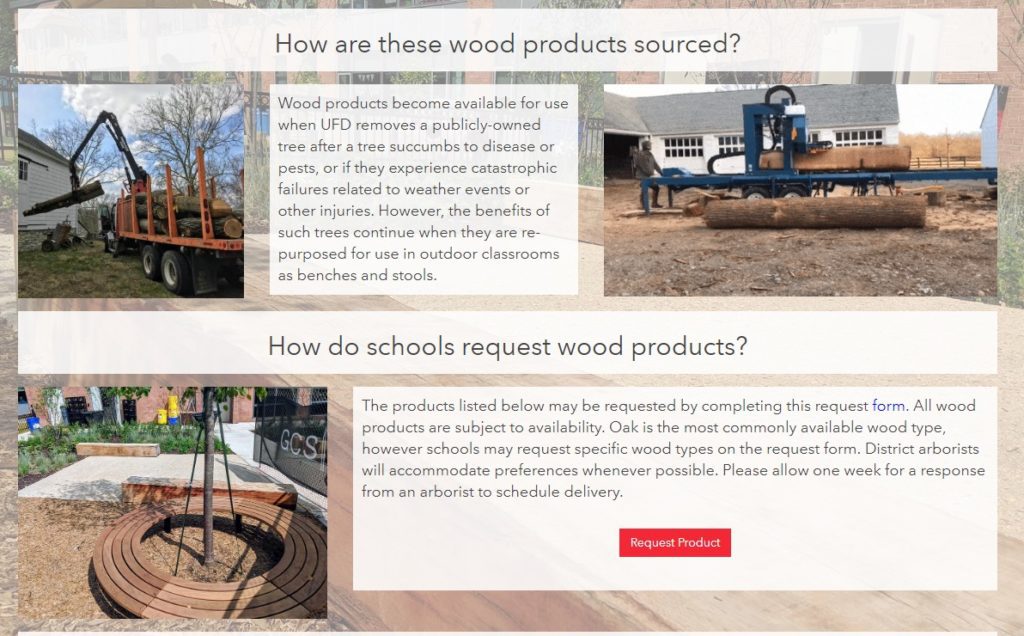
The site discusses the benefits of wood reuse, where the wood comes from, and the variety of products available including benches, stumps, or woodchips. It also provides a link to an order form as a convenient and easy way to request wood products.
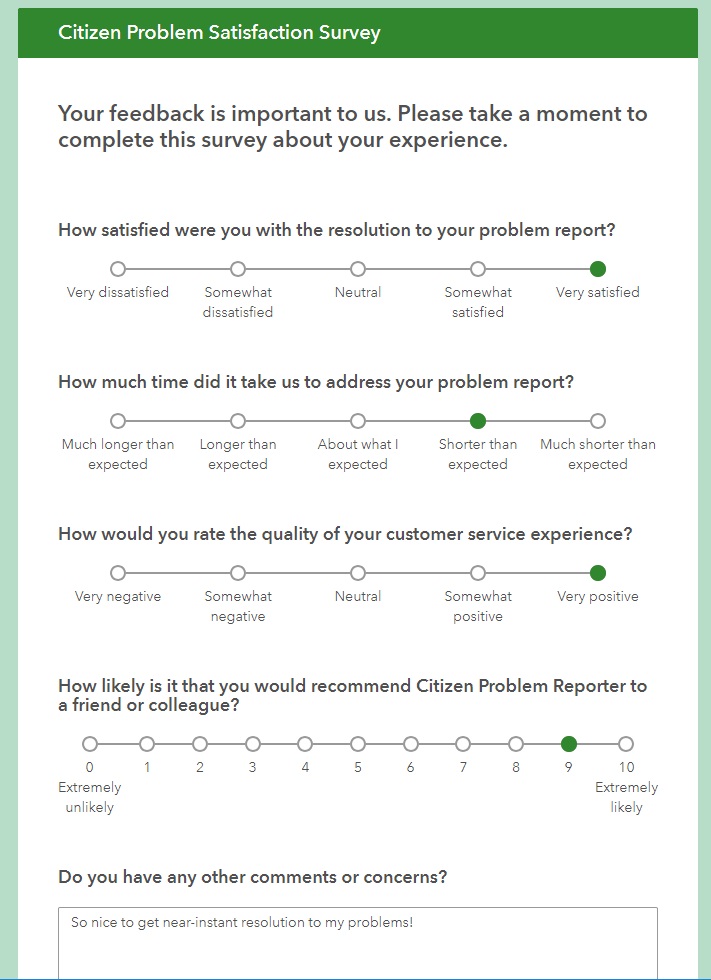
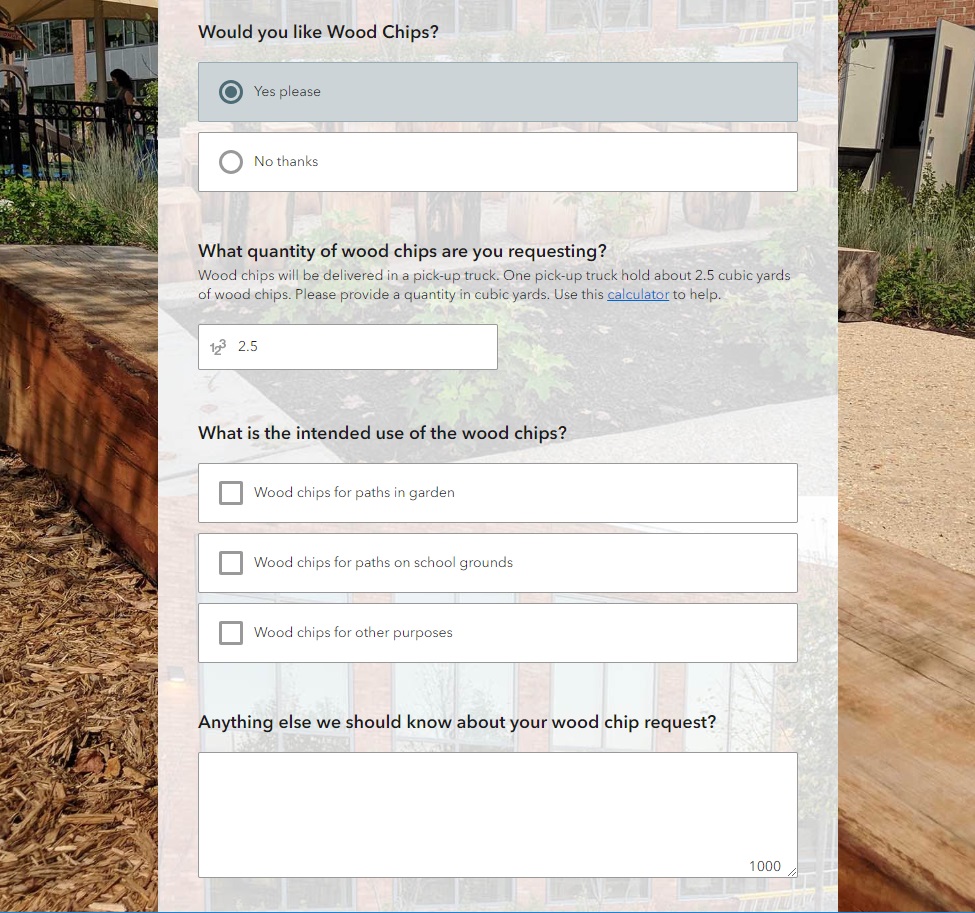
The order form itself is powered by Esri’s Survey 123 for ArcGIS technology and is designed with step-logic where pertinent questions appear based on previous answers.
One of the exciting new aspects of an initiative is the ability for an audience member to sign into a community account and “follow” the initiative. This will grant them access to broadcasts about new events, updates, new product launches, and other useful information. Now, being able to show which schools are as excited as we are about this new initiative has never been easier!
Talk to our digital platform experts today if your agency or organization is interested in community engagement with the power of Esri ArcGIS Hub Initiatives – SymGEO is here to help!