Hurricane Tracker

With Hurricane Florence rapidly approaching the Carolinas, the scale and power of the storm was truly terrifying. From eye of the hurricane video, provided by the NOAA Hurricane Hunter (9 second mark below), to overhead imagery from NOAA showing the churning vortex, it was only a matter of time before the devastating effects of the hurricane would be felt.


Armed with Esri technology and the thirst for knowledge, SymGEO explored the Living Atlas of the World data sets until we found The National Digital Forecast Database (NDFD).

“The NDFD was designed to provide access to weather forecasts in digital form from a central location. The NDFD produces gridded forecasts of sensible weather elements. NDFD contains a seamless mosaic of digital forecasts from National Weather Service (NWS) field offices working in collaboration with the National Centers for Environmental Prediction (NCEP). All of these organizations are under the administration of the National Oceanic and Atmospheric Administration (NOAA). Wind Gust is the maximum 3-second wind speed (in knots) forecast to occur within a 2-minute interval at a height of 10 meters. Wind gust forecasts are valid at the top of the indicated hour. This feed consumes NDFD’s files and calculates the amount of forecast wind gust for the next 72 hours.”

– from NDFD metadata

This information was explored in ArcGIS Online and showed the scale and timing of the expected hurricane landfall.
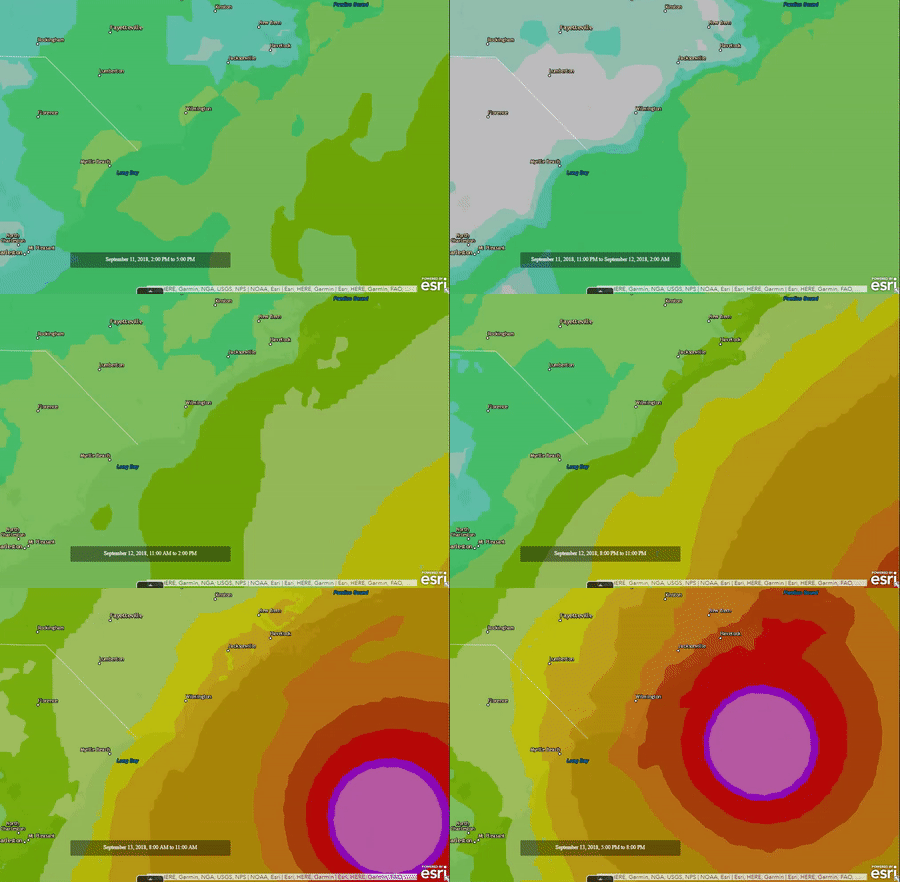
animated hurricane data

Finally, this data was wrapped in a time-aware, mobile responsive template in ArcGIS Online and tested to make sure it was pulling current data.
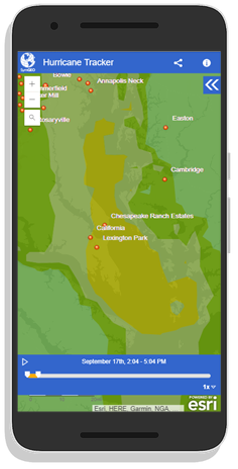
hurricane tracker phone

Check out the Hurricane Tracker today and let us know if you have an idea that SymGEO can help you with!
Land Area by Zoning

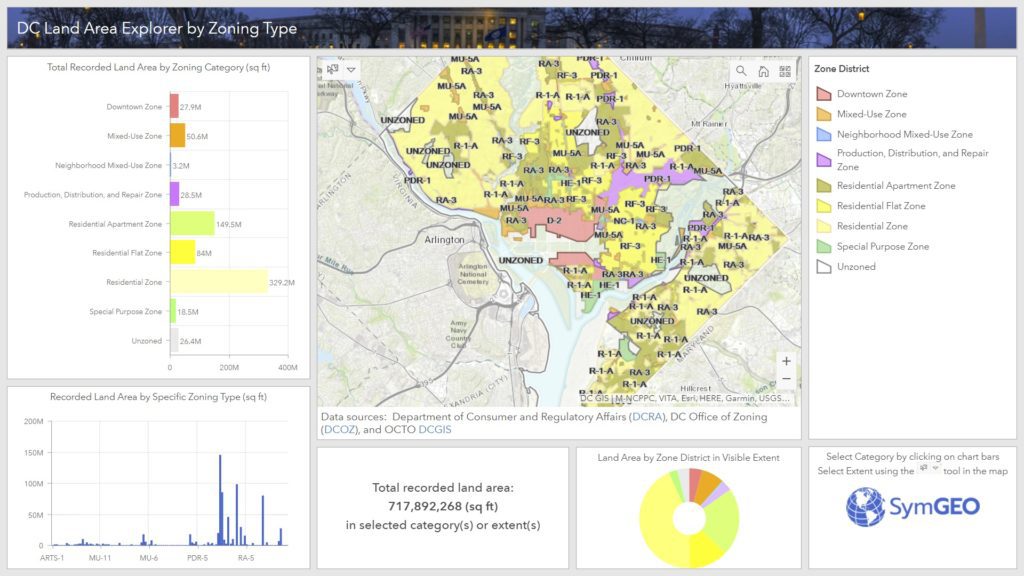
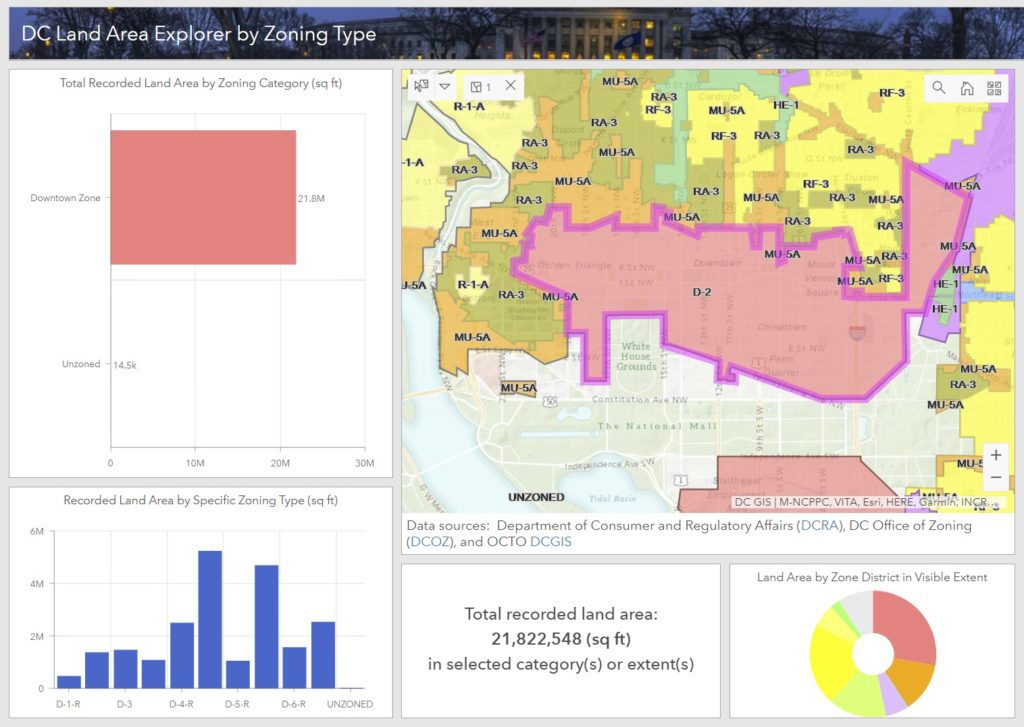
Ever wonder how much land area there is in DC by zoning district or specific zone? Well, wonder no more, as we sliced and diced the data, and created the DC Land Area Explorer by Zoning Type. This application leverages Esri‘s select by chart category functionality in ArcGIS dashboard. Data is kindly provided by our friends at DC Office of Zoning (DCOZ),  the Department of Consumer and Regulatory Affairs (DCRA), and a fabulous basemap by OCTO’s DCGIS team.

Users can select zoning categories or specific zones by clicking on the bars in the charts. This will update the total recorded land area calculation to just the selected zone(s). Alternatively, for really detailed analysis, zooming into the map and using the “select” tool in the map window allows the selection by zoning district, specific zone, or even property boundaries.

Take a look at the DC Land Area Explorer by Zoning Type, and if you have data you’d like sliced, diced, sauteed or… you know who to contact!

Server, Portal and Enterprise

Publishing, organizing, and making data accessible on the web can be tricky business in an ever-changing technical landscape. Not surprisingly, there isn’t a “one-size-fits-all” solution due to the number of infrastructure variables involved in setting up your own data server.

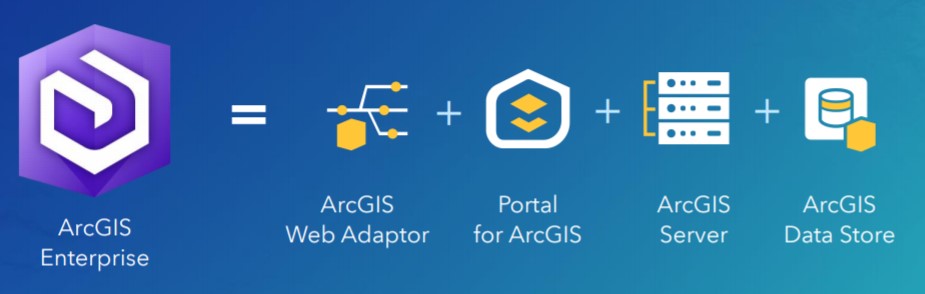
ArcGIS Enterprise, a relatively new product offering from Esri, is designed to help streamline the process and provide maximum flexibility on deployment scenarios. Enterprise is a full-featured mapping and analytics platform that includes a powerful GIS server, plus dedicated web-based GIS infrastructure to organize and share your work.

enterprise

Enterprise includes:

  • An enterprise GIS portal for organizing and sharing GIS assets.
  • A data store for secure storage and fast access to maps and data.
  • Optional GIS capabilities for real-time imagery and large data processing.
  • Even more capabilities when you opt for GIS server extensions.
  • An enterprise geodatabase, the ultimate in geodata storage and management.

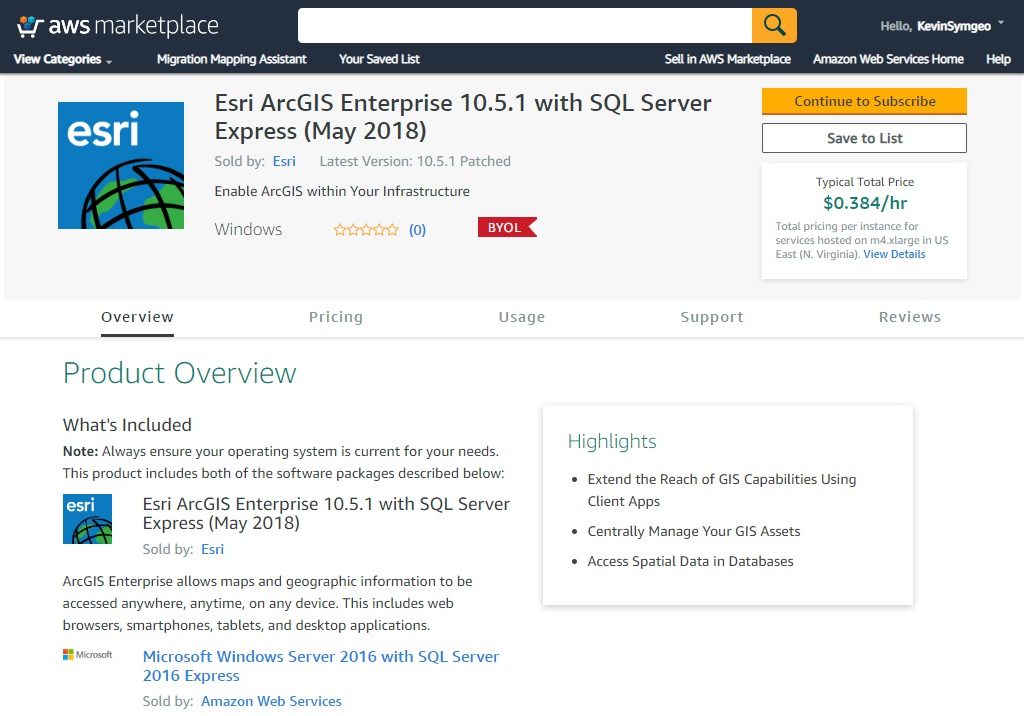
Esri offers a number of solution components that are ready to be implemented; both in the cloud through Amazon Web Service (AWS) or Microsoft Azure, or on premise using your own server.

AWS enterprise AMI

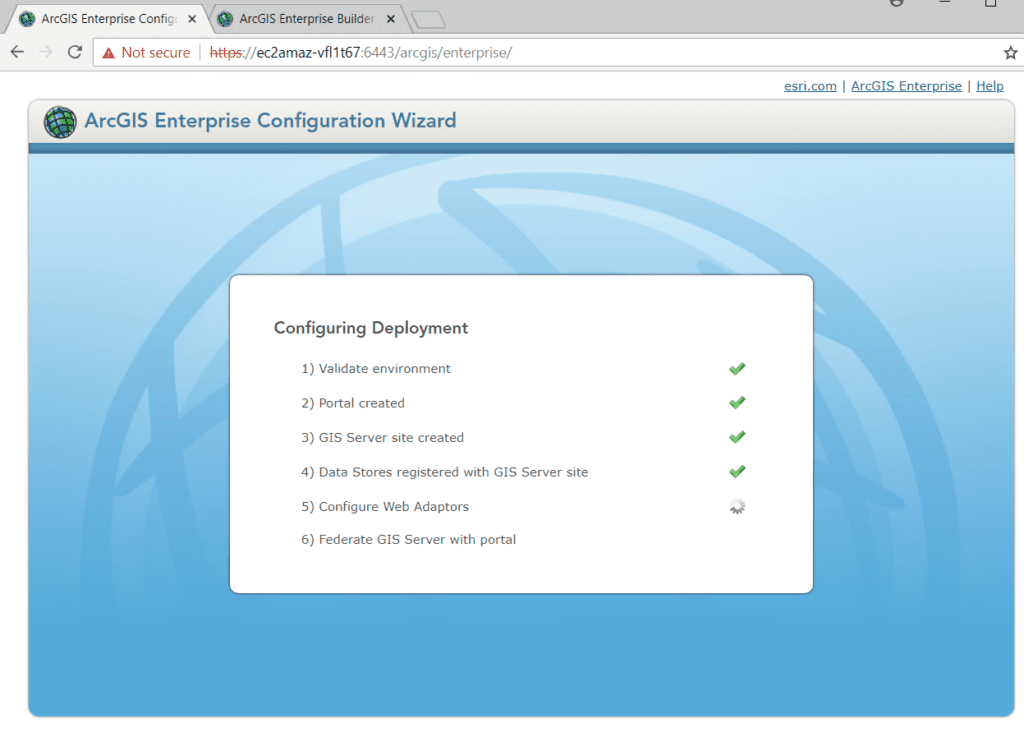
Based on our testing, the most easily accessible implementation is achieved using the Builder solution. However, even that implementation has a few tricky steps that involved manually configuring web adapters, setting bindings, web context URLs, and static public IP addresses.

enterprise builder

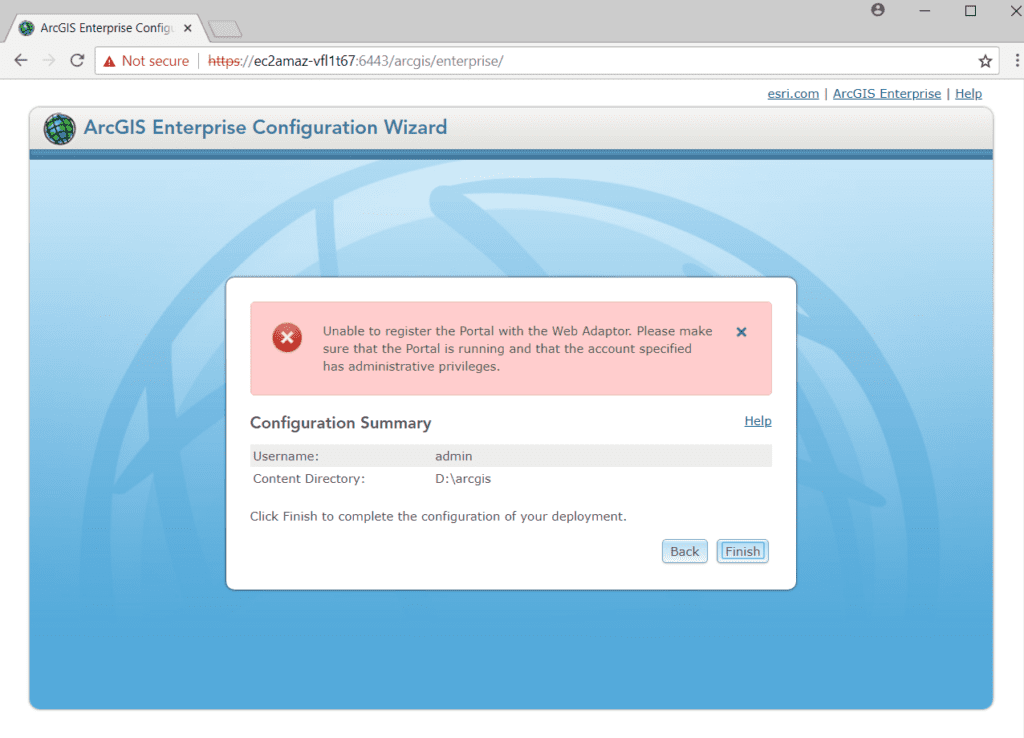
Fortunately, when it does error out, the error messages are usually quite specific and pointed us in the right direction.

portal registration error

There is also a very active internet community ready to jump in and help on this topic. When all else fails, Esri tech support is the most patient, educational crew around based on our experience of several hours of configuration trouble-shooting.

Once Enterprise is successfully installed, user groups, permissions, logins and account set up is relatively easy. This allows each user the required level of access, and complete control over the branding and visibility of your data.

If you’re ready to set up Enterprise, Server, or Portal, let SymGEO know as our highly trained technical staff are here to help.

Commercial Property Management

Keeping track of who is where, what’s coming soon, square footage available, and when leases are ending can be quite a challenge when hundreds (or thousands!) of properties are involved. Fortunately, GIS is perfectly suited to this task of commercial property management, as it combines space, time, attributes and symbology into one cohesive picture.

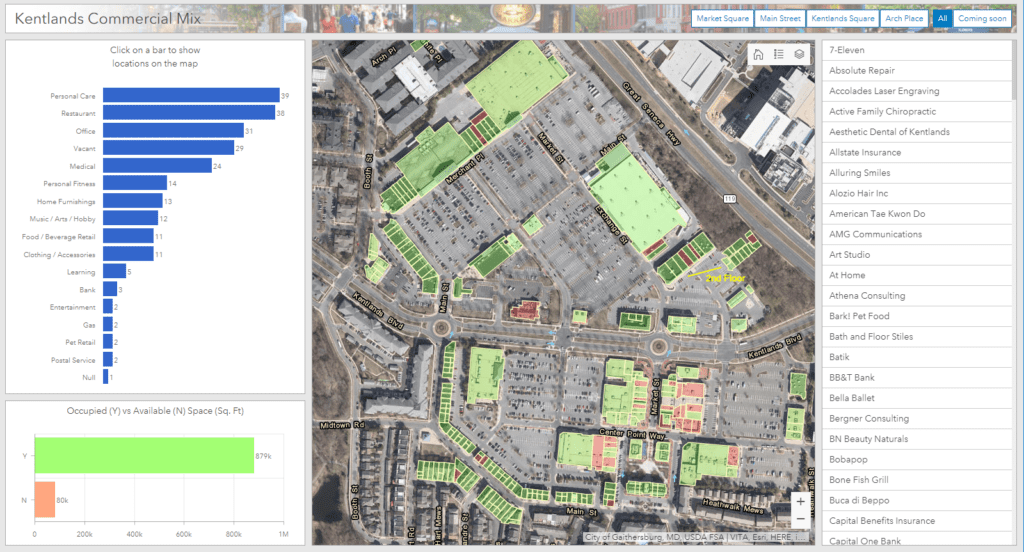
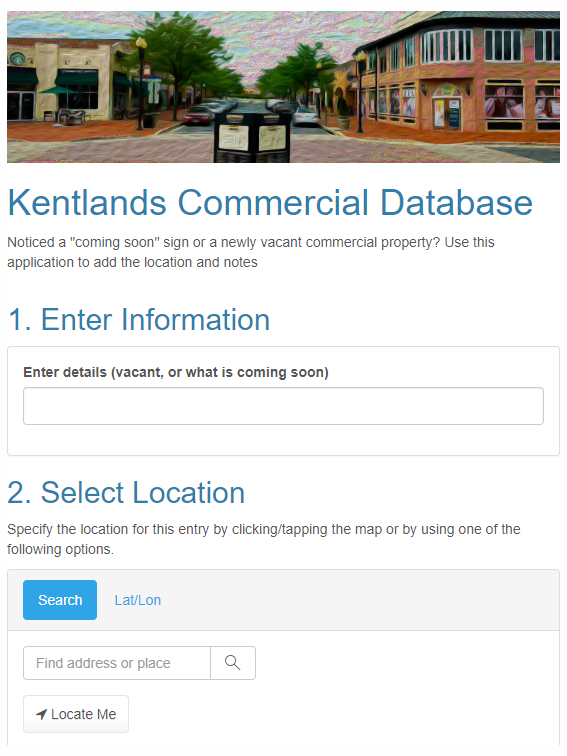
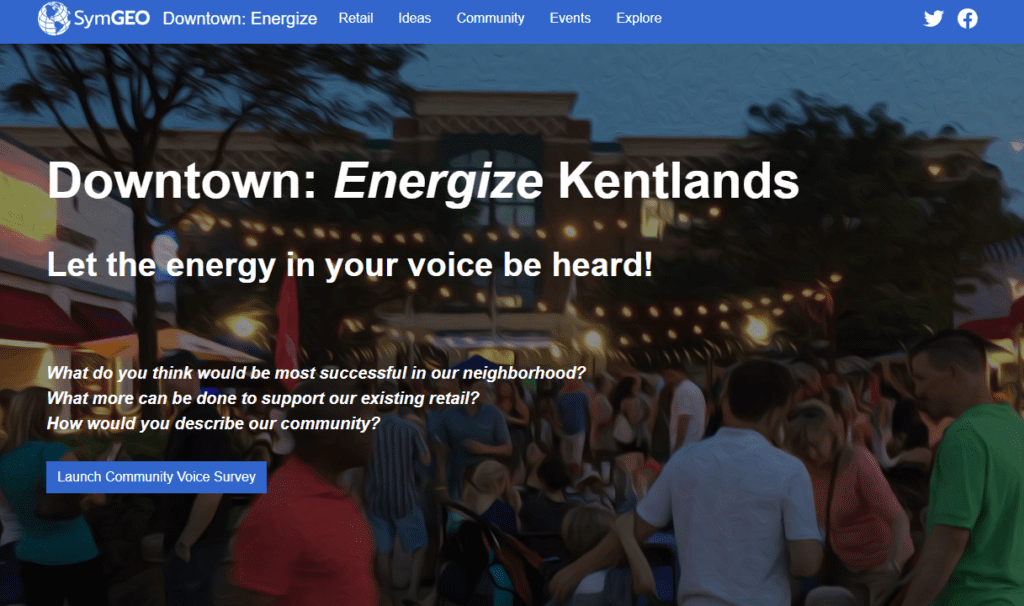
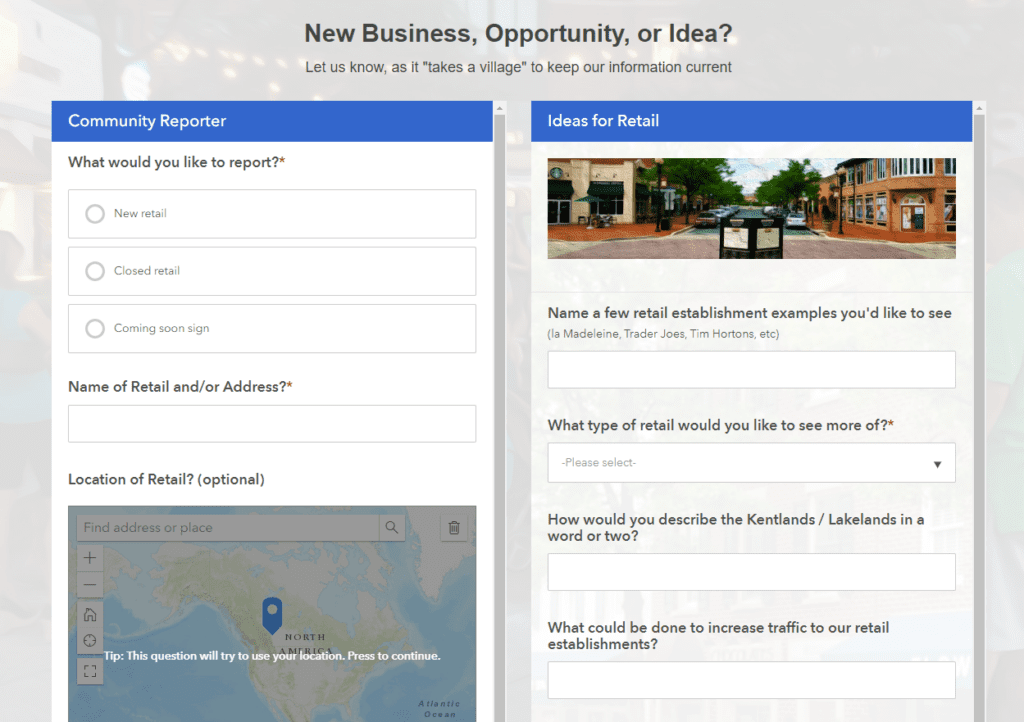
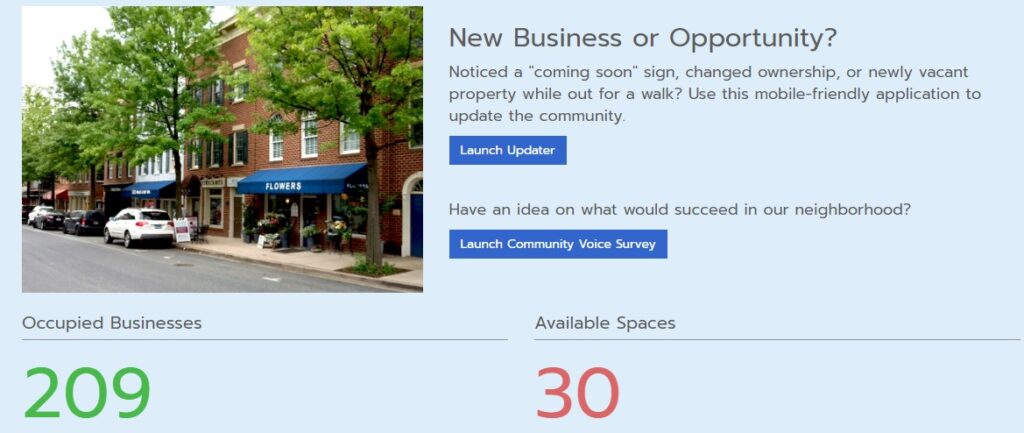
For the Kentlands community in Gaithersburg, MD, ArcGIS Online data was used to power an initiative called Downtown: Energize!, that has garnered critical acclaim from residents and business owners alike. This Hub site designed to explore existing retail, gather community ideas, and identify opportunities for commercial business. With almost a hundred commercial properties involved, including several large commercial parcels, the data came in the usual assortment of formats (pdf, GIS, field collection). However, the end result was a cohesive framework designed to be updated and informed by the community it serves through a crowd-sourced GeoForm application.

data updater

geoform

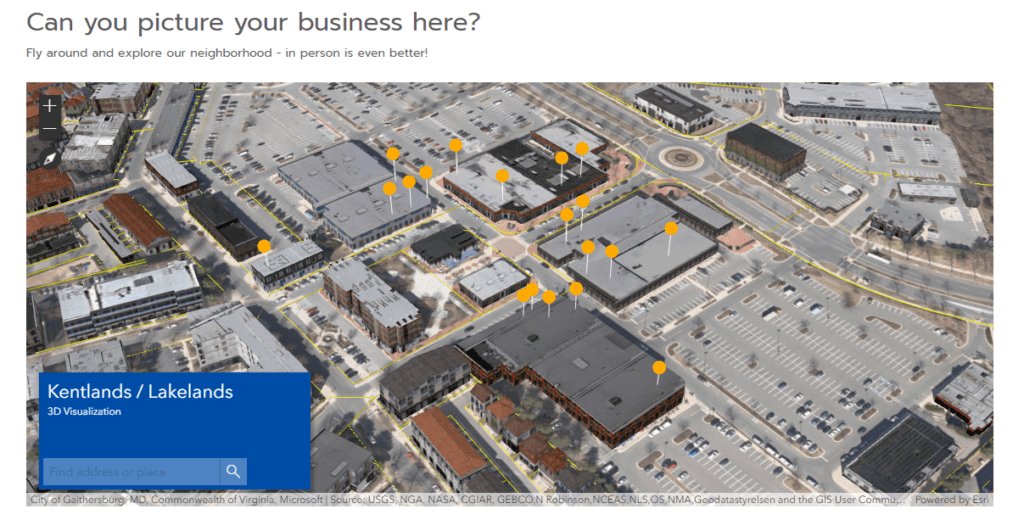
Searching by business name was enabled through a configurable application that is embedded into the Hub site. There is also active development and building reconfiguration occurring in this area, as shown below with the current buildings overlaid on last year’s imagery. This solution provides a one-stop shop for information about current commercial businesses in the area, and a common platform for the community to use.

If your community is ready to get started with a Downtown: Energize! initiative or your business would like to use GIS as a property management tool, let us know as SymGEO is here to help!

Remote Sensing of Wetlands

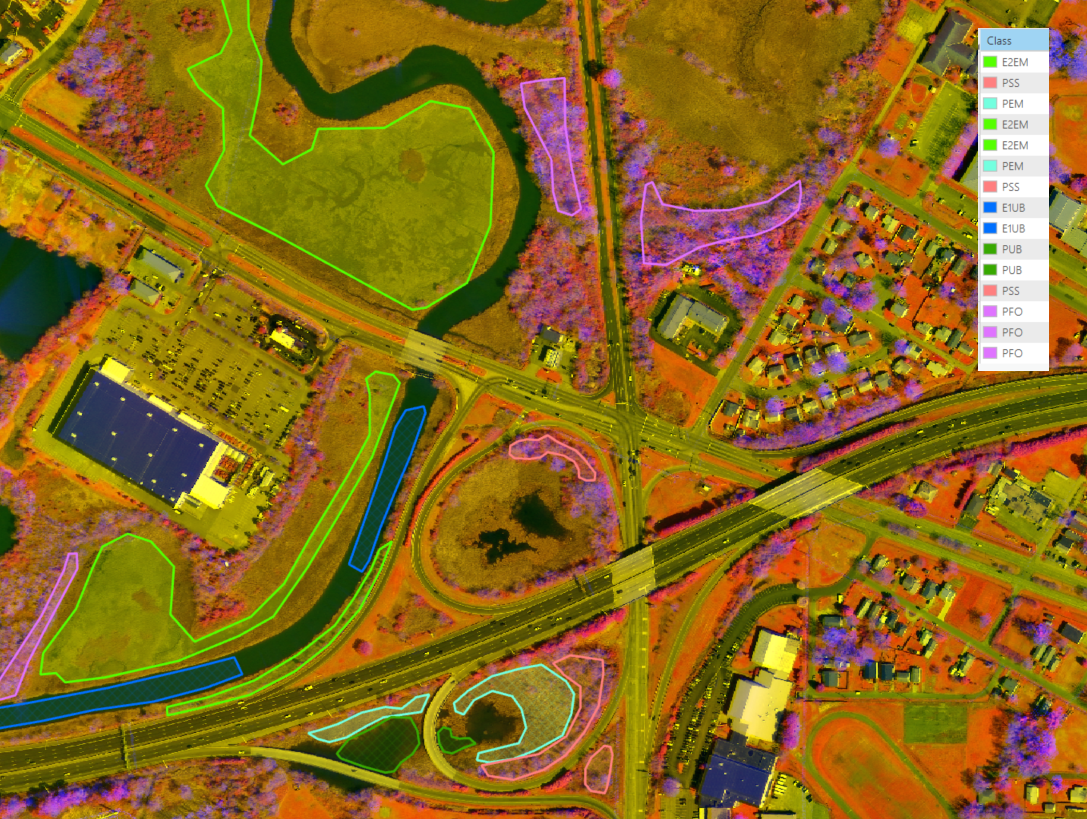
SymGEO is proud to announce a new project with the Virginia Department of Transportation (VDOT), designed to explore the use of remote sensing techniques in the identification of wetlands. Traditional wetland delineation requires expert field work, which includes many hours of travel, sampling, and precise survey measurement to delineate what can actually be quite a variable environmental boundary. The best indicators of wetlands tend to be the vegetative species, ground elevation, and hydrology connectivity. Soil sampling and other methods are used to further validate findings, but in today’s data-rich environment, a pretty good indication of wetlands can be gathered through remote sensing.

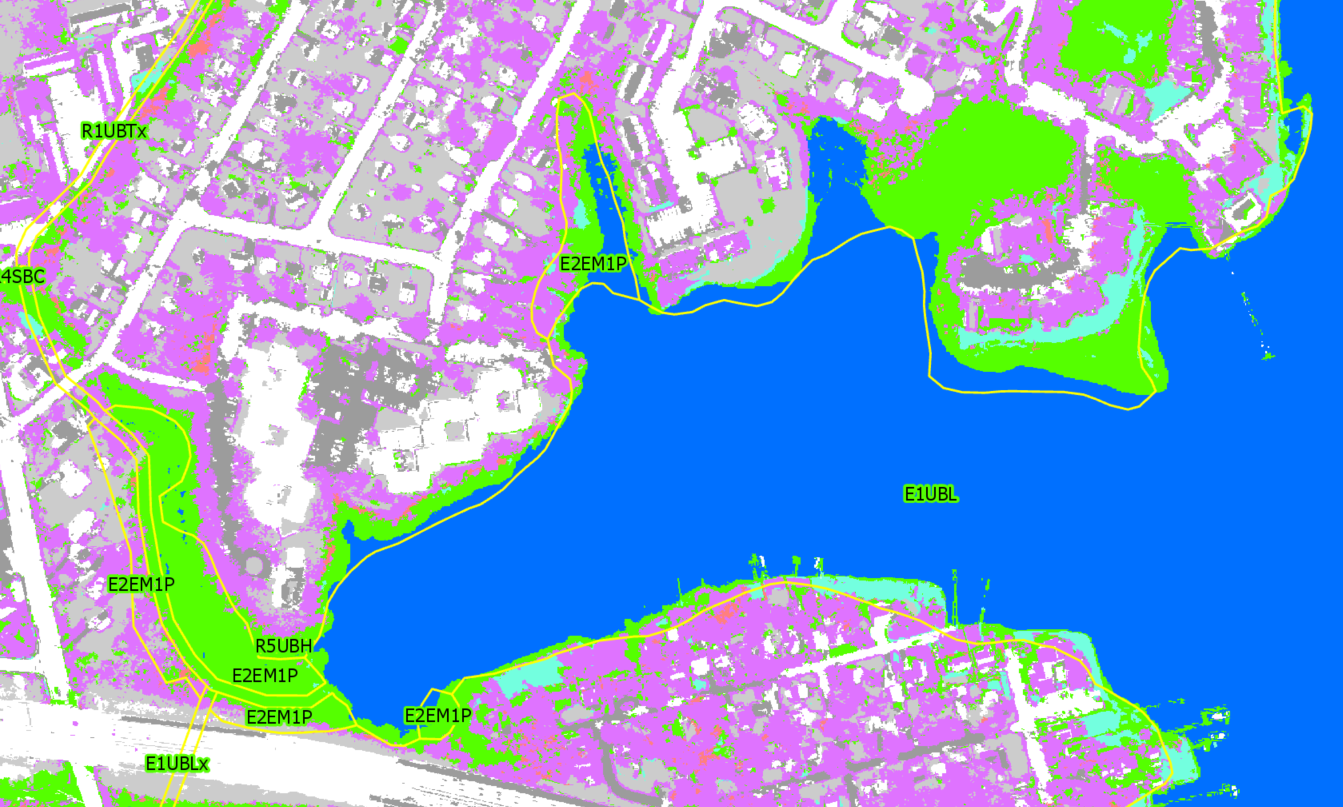
For this project, LiDAR elevation information was combined with multi-spectral imagery to produce a 6-band composite image using ArcGIS Pro. This composite image was then used in conjunction with National Wetland Inventory (NWI) data to establish training sites for a supervised classification algorithm.

Once a suitable number of training sites were established, the supervised classification algorithm was run on the pilot study area. The results were compared with the National Wetland Inventory data, and a substantial improvement in boundary alignment was noted. This is critical in the accurate measurement of potential impacts to wetlands during road construction or property development, so that an equivalent, mitigating wetland area can be created elsewhere.

It was noted that upland forested areas were sometimes identified as wetland forested areas, indicating that elevation relative to nearest water needs to be included in the classification algorithm. The classification results are currently used as a guide for semi-automated wetland area delineation, but we believe the model could mature to include all required factors and accurately, automatically delineate the wetlands.

If you have supporting data and a need for efficient wetland delineation, SymGEO would love to talk!

Sledding Locator

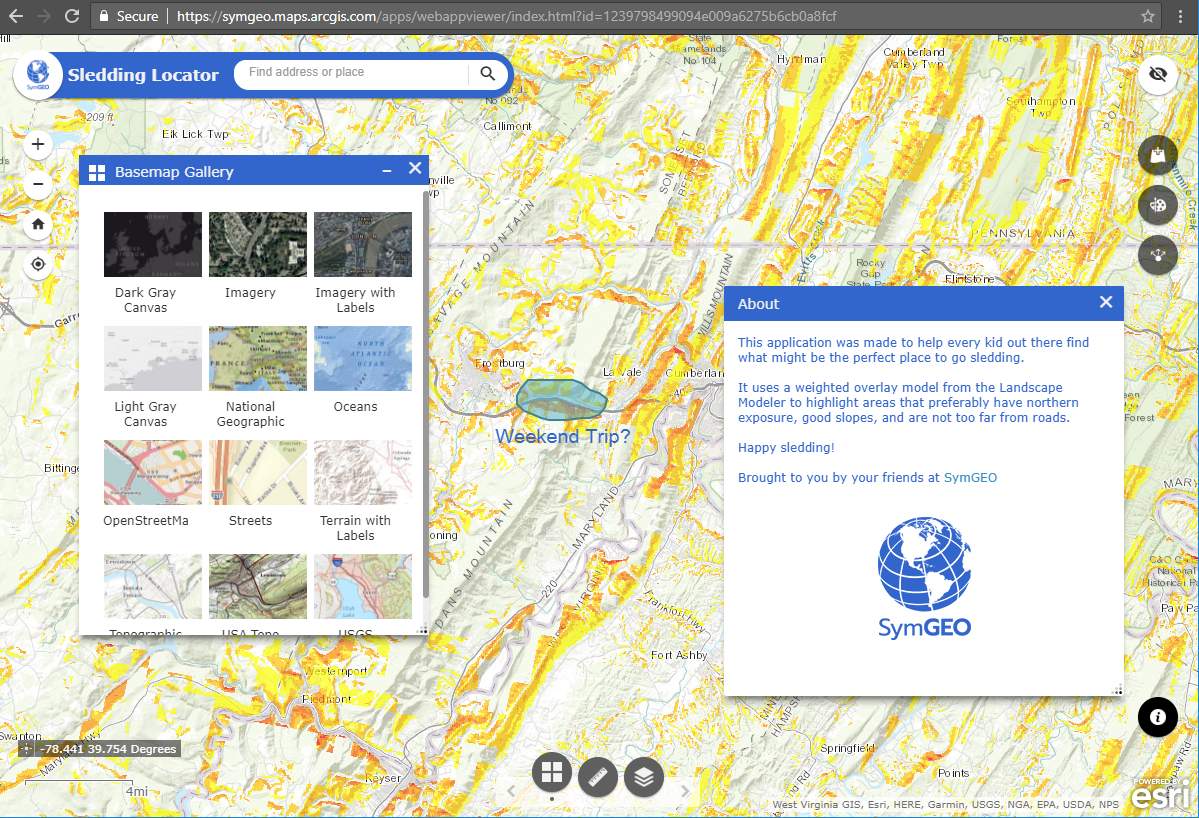
Sledding and July don’t usually go together, but what better time to plan out the winter’s adventures? This is the quintessential example of an idea that took 6 months to mature and then a few hours to accomplish, thanks to the power of Web AppBuilder and Landscape Modeler.

Like all great solutions, I was trying to do something else (boring technical details redacted), but happened on the Landscape Modeler which had most of the needed architecture already in place. By wrapping the model into an application configured using Web AppBuilder, the Sledding Locator was created in a matter of hours.

Sledding Locator

This application leverages a weighted raster overlay (WRO) model that specifically targets northern-facing sloped areas with roads in the general vicinity. When combined with some of the other basemap layers, particularly imagery to see if it’s relatively open lands, users will be able to tell if it’s worth scouting out for sledding potential following a snow-storm!

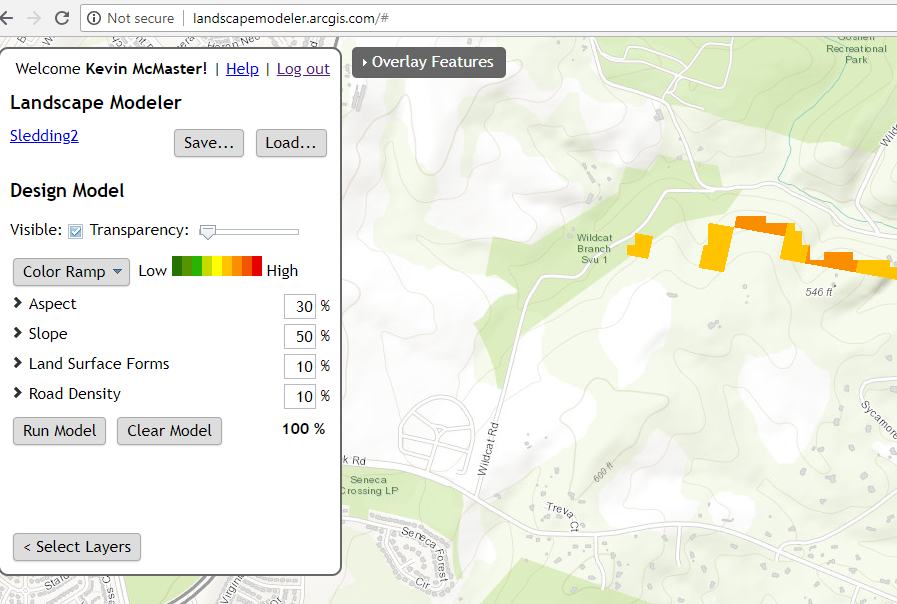
Landscape Modeler

From the technical Esri documentation: Weighted overlay has three conceptual steps. First, each raster layer is assigned a weight, as a percentage, in the analysis. This allows you to emphasize the relative importance of each layer in the analysis. Second, values within each raster layer are mapped to a common suitability scale. This allows you to compare the different types of information in each raster layer. Third, all raster layers in the analysis are overlaid. Each raster cell’s suitability value is multiplied by its layer weight and totaled with the values of other raster cells it overlays. The result is a suitability value that is used for symbology in the output raster layer.

Two input rasters have been reclassified

A number of other handy tools are included in this mobile responsive application so users can add their own data, add map annotations (drawings and text), or share the application with their friends.

Check it out today and let us know if you have an idea that SymGEO can help you with, or send us pictures of awesome hills you’ve found with the app!

Waze Traffic in DC

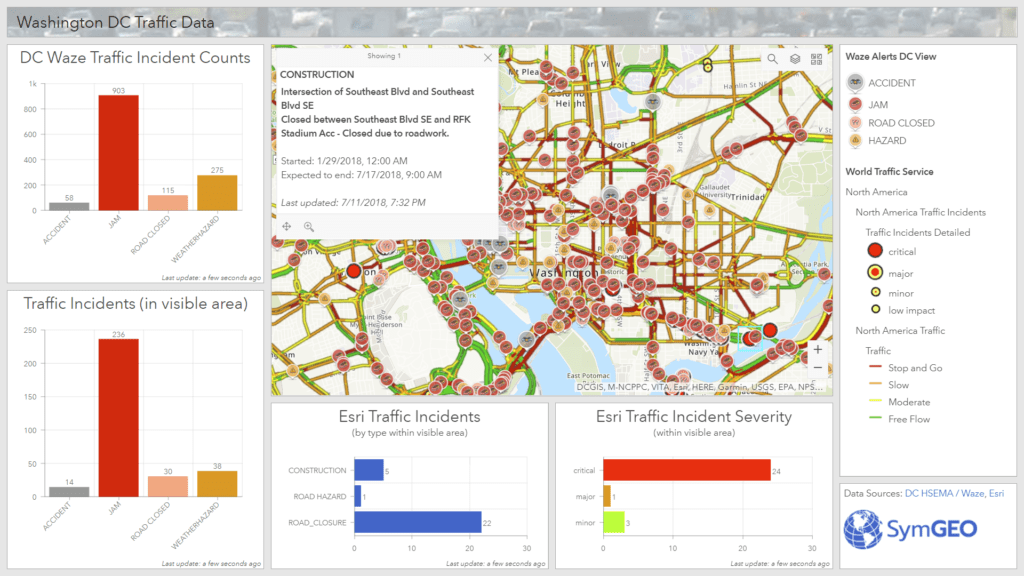
Waze and Esri recently announced an expanded partnership, giving cities easier access to traffic conditions data and incident reports. Esri also has a traffic layer updated every 5 minutes, with road closure notices and other important information included. By combining these near real-time data sources with the marvels of modern technology, SymGEO is pleased to unveil the DC Traffic Dashboard.

Use the DC Traffic Dashboard to plan your commute, see what’s in store, or enjoy your day of telework that much more! Contact SymGEO for more info or for your own handy-dandy dashboard.

Downtown: Energize!

Community engagement and business development are key ingredients for a successful neighborhood. Rapid advancements in web technology have made it easier than ever to engage with your citizens and neighbors and to create a real sense of ownership and responsibility for the direction of the community. To facilitate community engagement from a retail business perspective, SymGEO created Downtown: Energize! using ArcGIS Hub technology.

The site was well-received by residents and business owners, has been featured in several local newspaper publications, and in Esri’s ArcNews publication entitled “ArcGIS Hub Gets Mixed-Use Community Involved in Retail Decision-Making“. It also showcases a commercial real-estate management system designed to keep track of existing businesses, future businesses, and available locations.

Downtown: Energize! includes:

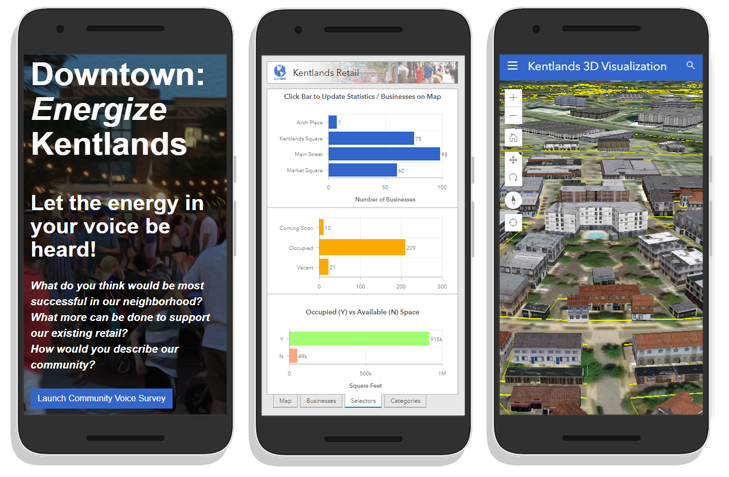
  • An idea section for the community to voice what type of retail they would like to see, powered by Survey123.


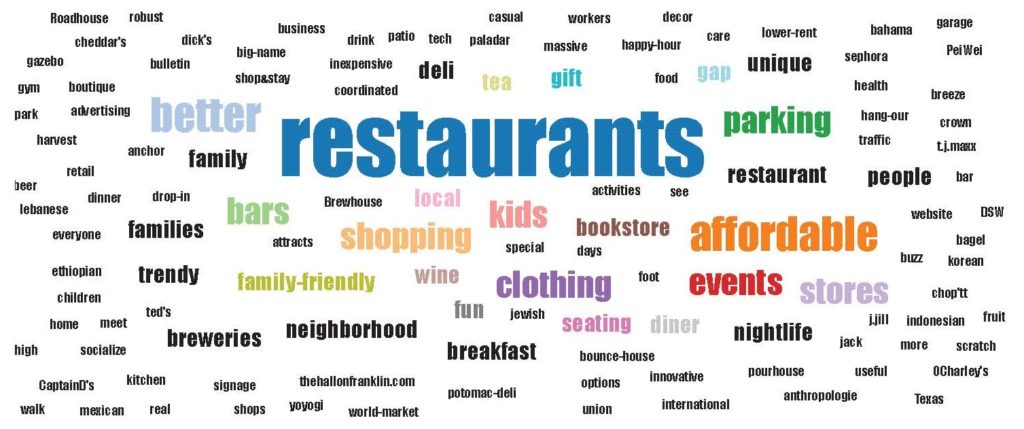
  • Word-clouds generated from community surveys into the types of retail that are needed

  • An opportunity locator section to highlight available commercial properties, powered by GeoForms and Web AppBuilder 

  • A look at existing retail in the neighborhood

cornerstone retail

  • Lots of great neighborhood-specific data from Esri

3d energize

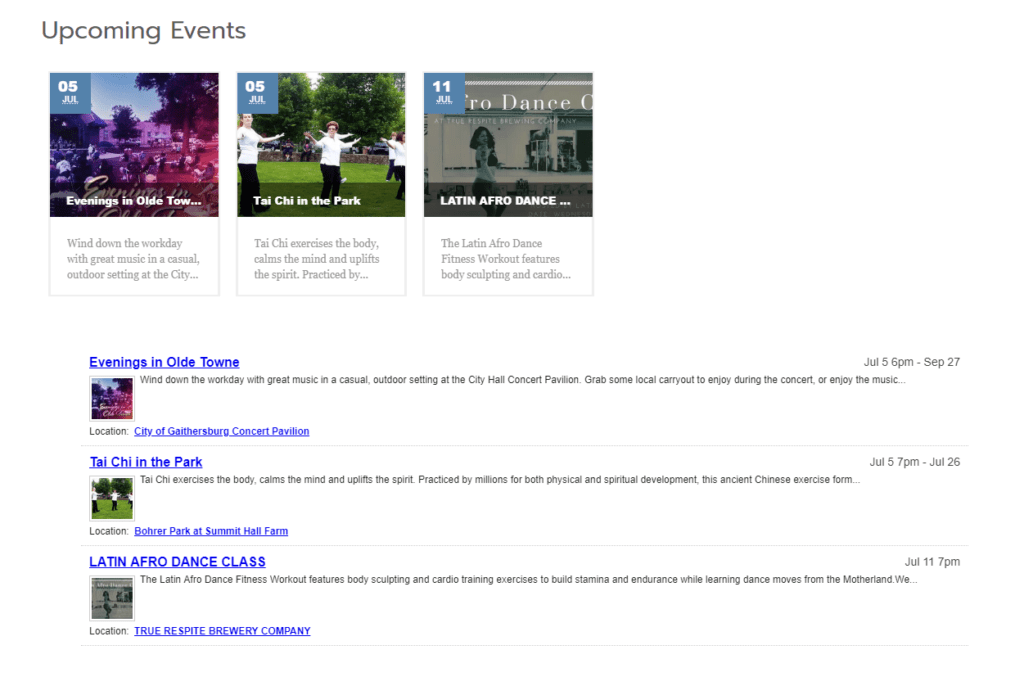
  • Links to upcoming neighborhood events to show local activities

community events

Everything is fully mobile responsive using modern Esri web architecture, ensuring community access and interactivity on the go.

If your community is ready to get started with Downtown: Energize!, let SymGEO know as we are here to help.

ArcGIS Hub-Ready

The world is awash with data and mapping applications, so how does one go about organizing them into meaningful, searchable components? Esri’s new ArcGIS Hub initiative is designed to organize people, processes, and technology to meet those needs. This technology gives context and purpose to data, and provides an excellent two-way engagement platform to connect departments and stakeholders.

Using this mobile-responsive framework, SymGEO has built our own SymGEO Hub, and populated it with examples and branding from our main website.

If your organization is ready to get started with ArcGIS Hub, SymGEO is here to help!

Data Collection

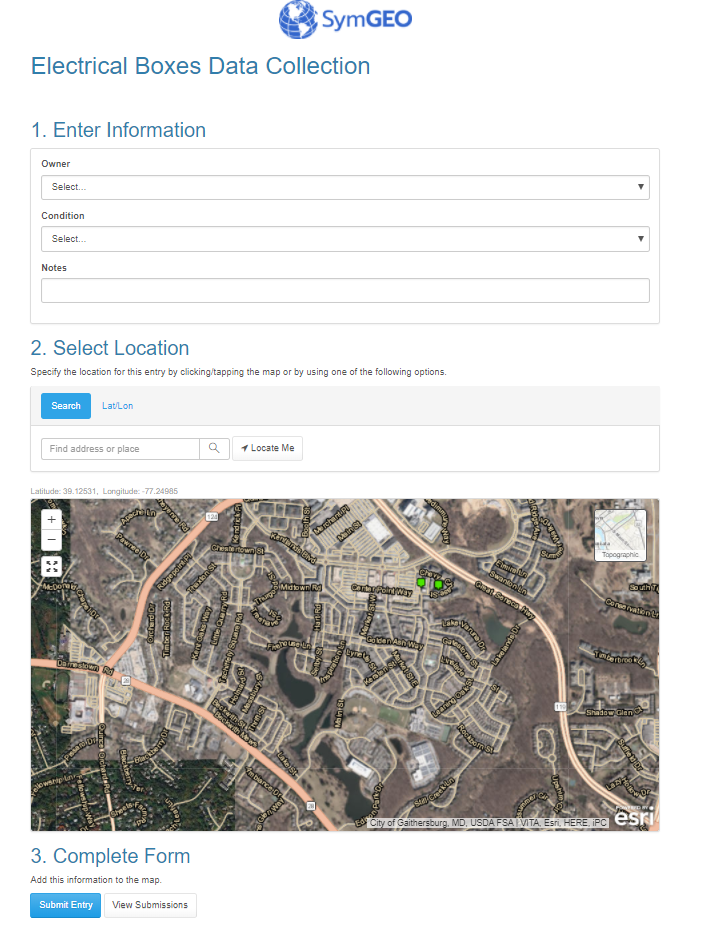
Specialized data sets that answer a focused need can be difficult or impossible to find, and sometimes the data set you need simply doesn’t exist. Maybe you need locations showing the availability of fresh food in your neighborhood, or want to know the location and condition of utility boxes, or the occurrence of garage sales. Fortunately, a number of configurable data collection products are available from Esri to help.

The first question to answer is: will you be able to tap into crowd-sourced power to populate the data set? If so, a publicly accessible web link is the way to go. Esri has introduced GeoForms and Survey 123, which allow any user to enter in the attribute information and location of the data when set to public. Alternatively, the permissions can be set so that just a specific group or user within your organization can access the forms.

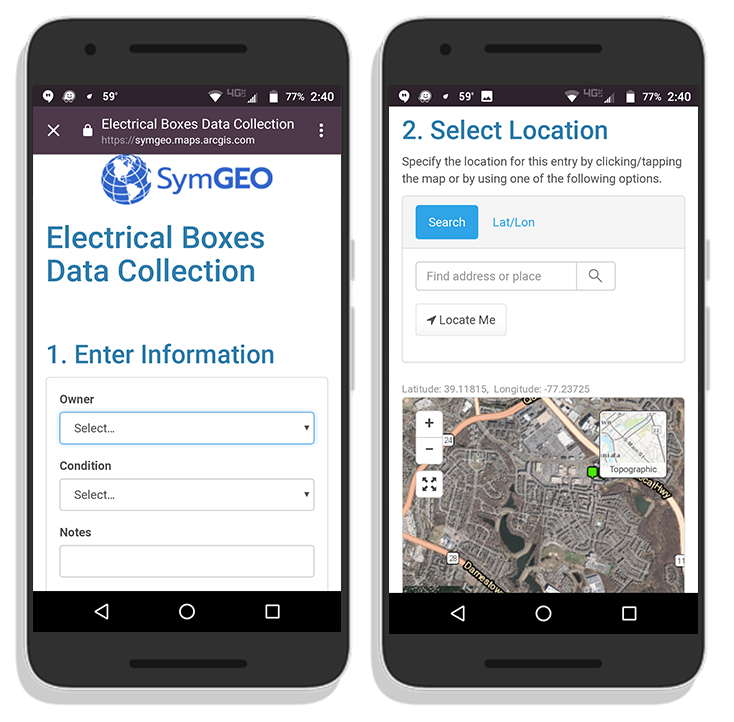
These configurable applications are mobile responsive, so fit very well onto a phone, where you can leverage the on-board camera to collect pictures at the same time.

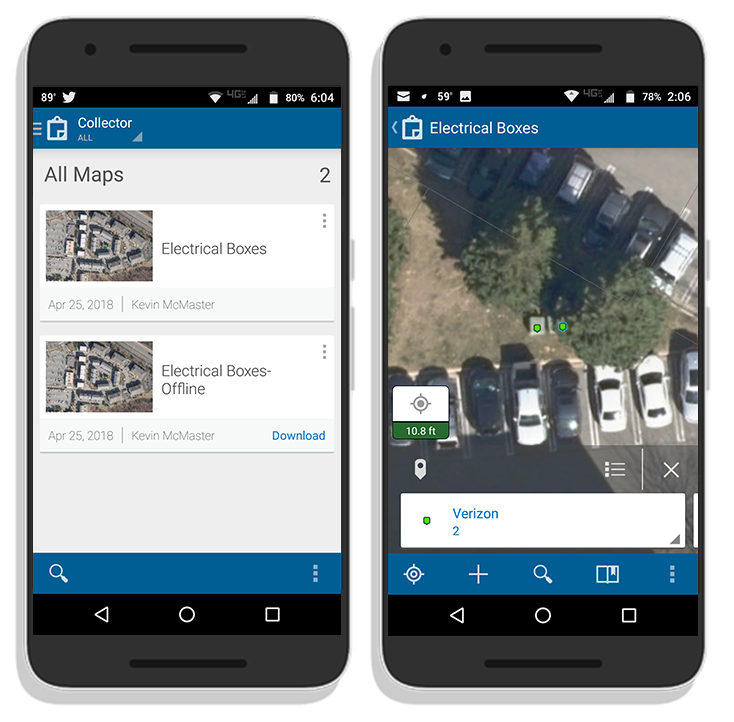
Another branch of data collection technology is Collector, which allows both connected and disconnected editing by named users. This may be useful in environments without access to mobile data or wi-fi, such as those following a disaster or storm event. These native applications are available for Android, iOS and Windows, and sync to data stored in ArcGIS Online or within an enterprise GIS when back in a connected environment.

If you’d like some help getting set up for mobile data collection, SymGEO is here to find you the perfect fit!