3D Building Visualization

SymGEO is excited to share a peek behind the scenes into our cutting edge 3D building visualization products leveraging Esri CityEngine and a little post-processing magic. The end result is a virtual environment that can’t wait to be explored! Each building is generated from building mass information or building footprints. Textures are added based on zoning information and can be fully customized if building photography is available.
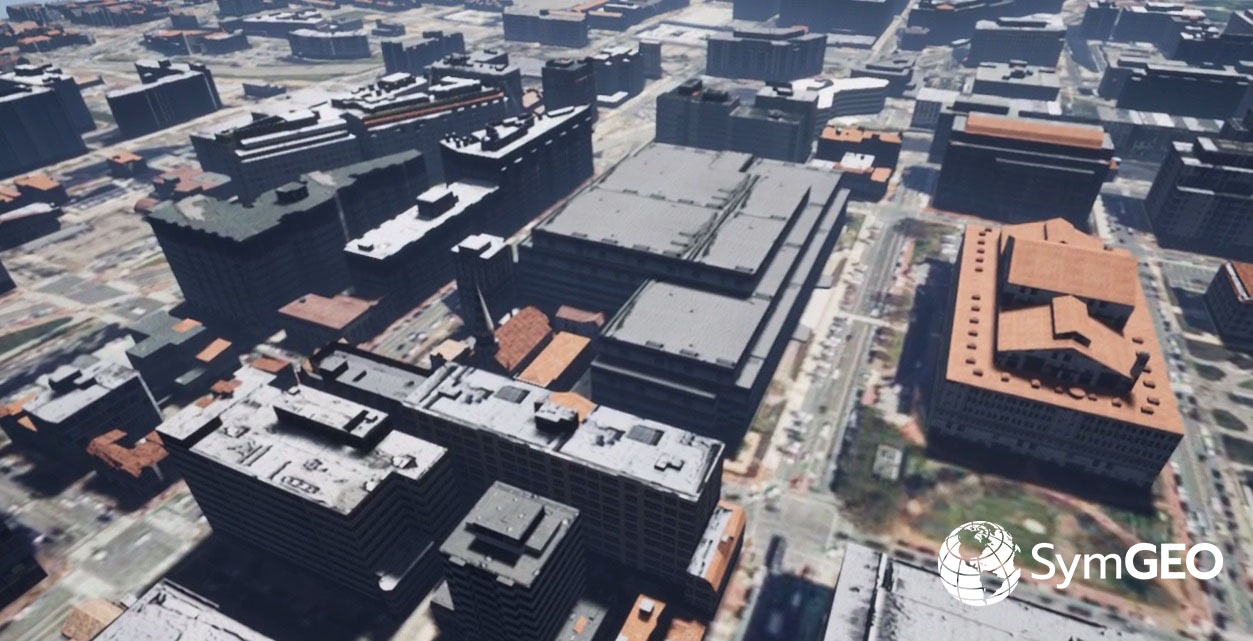
Once the existing environment is built out, the fun begins of playing “what-if” scenarios for proposed commercial or residential developments.
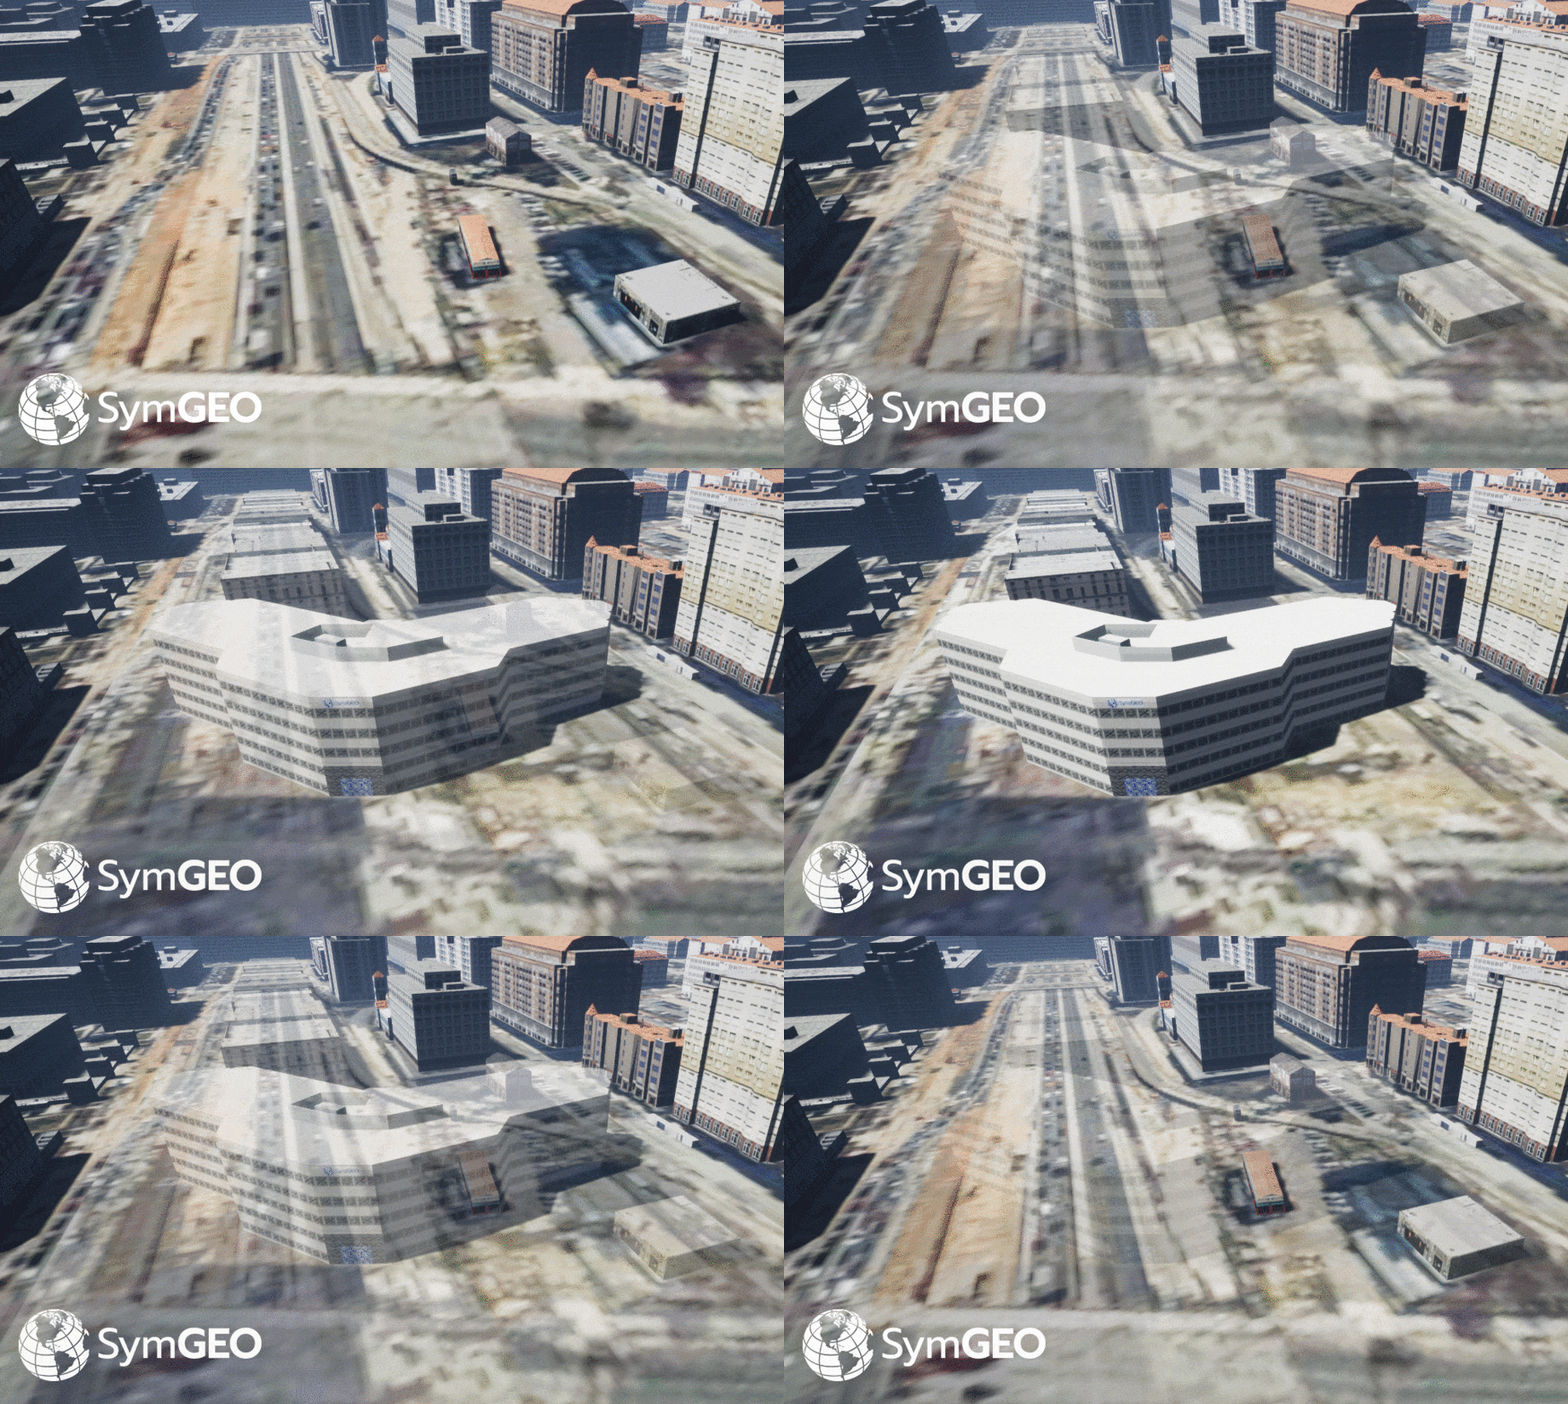
Full control over camera and environmental variables allows the presentation of 3D building data in the optimum light.
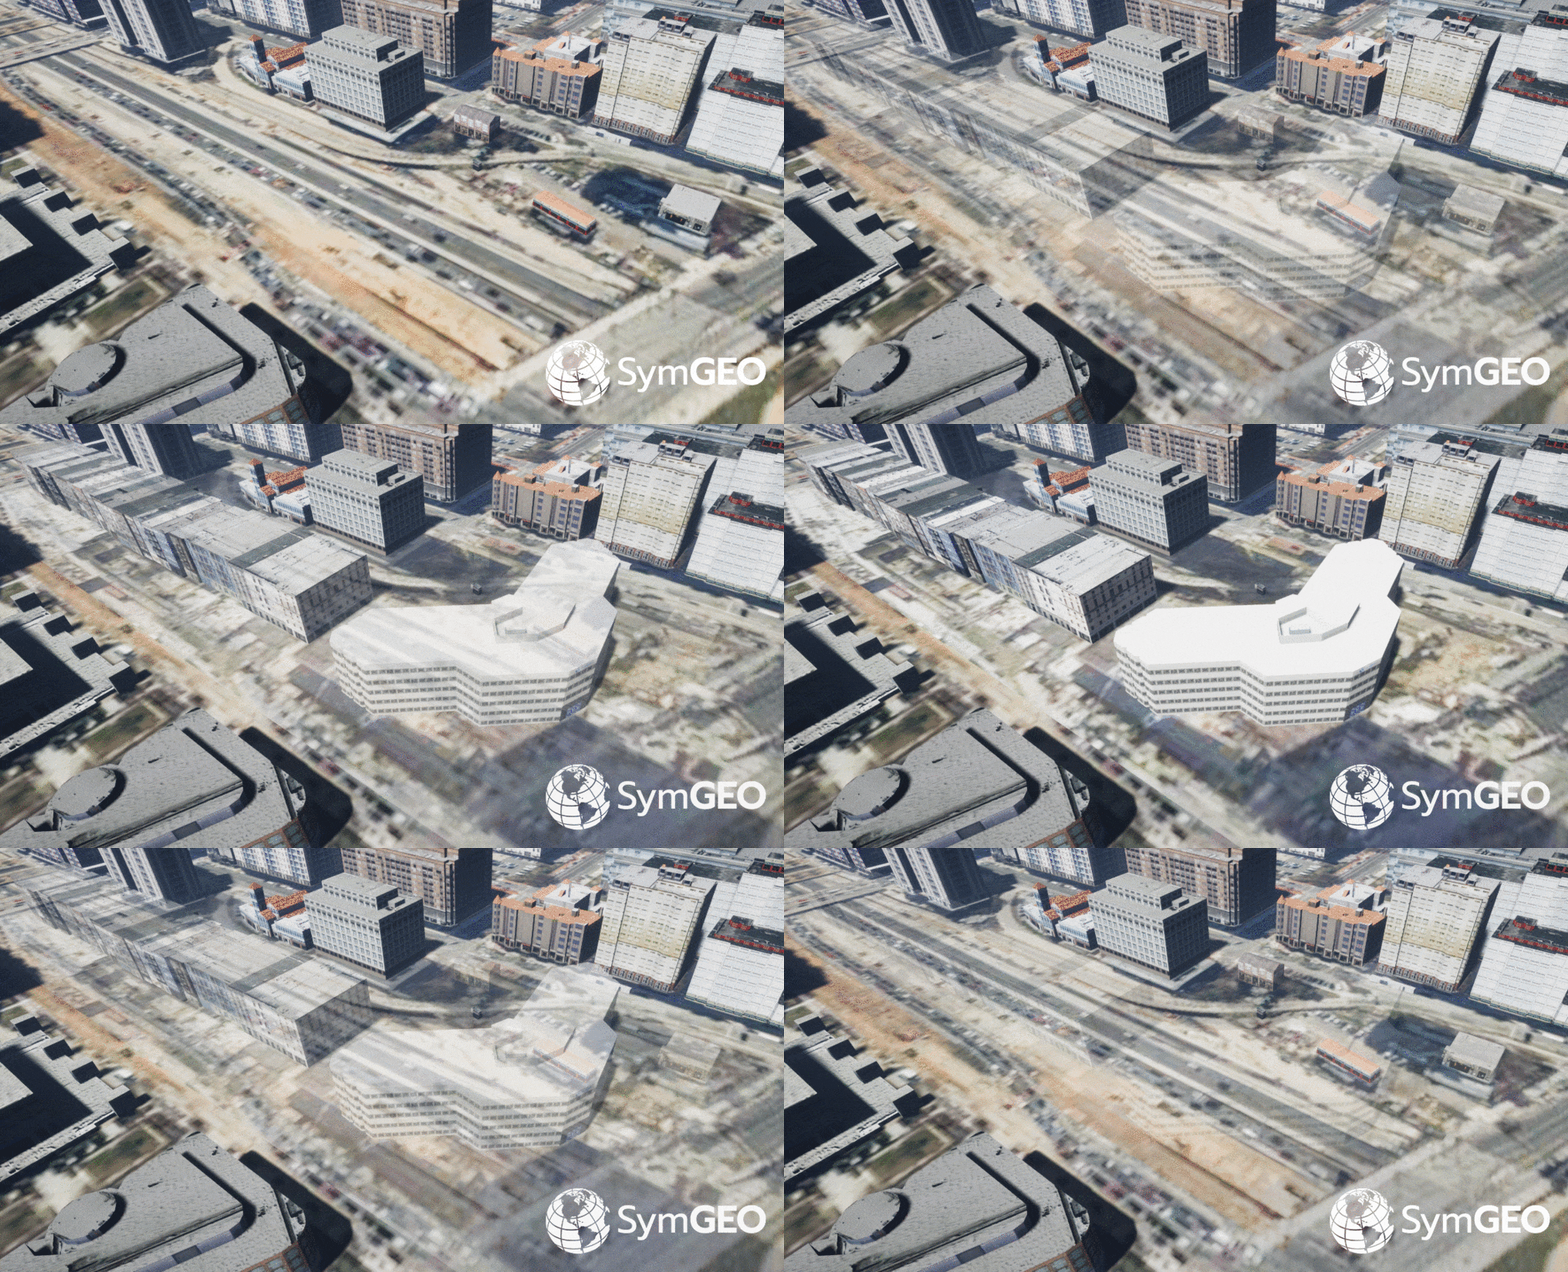
Video fly-over gives the ultimate in bird’s eye perspective and allows stakeholders full visibility into a proposed development.

Needless to say, this powerful combination of software makes compelling, cost-effective 3D building presentations a reality.

Check out our fun, promotional video on YouTube and let us know if your world is ready for this!

News for February, 2018

SymGEO News is designed to aggregate and share relevant and timely stories of geospatial data advances from around the web, and around the world. Knowledge sharing in this age of information is critical to advance the science – leading to better decisions and more insightful stories. Join us by subscribing, and share your story with our community!

News for February, 2018
SymGEO has launched a free interactive Global Water Risk Dashboard designed to help inform policy decisions around the world!

Read more


(Image from https://www.prepdata.org/)

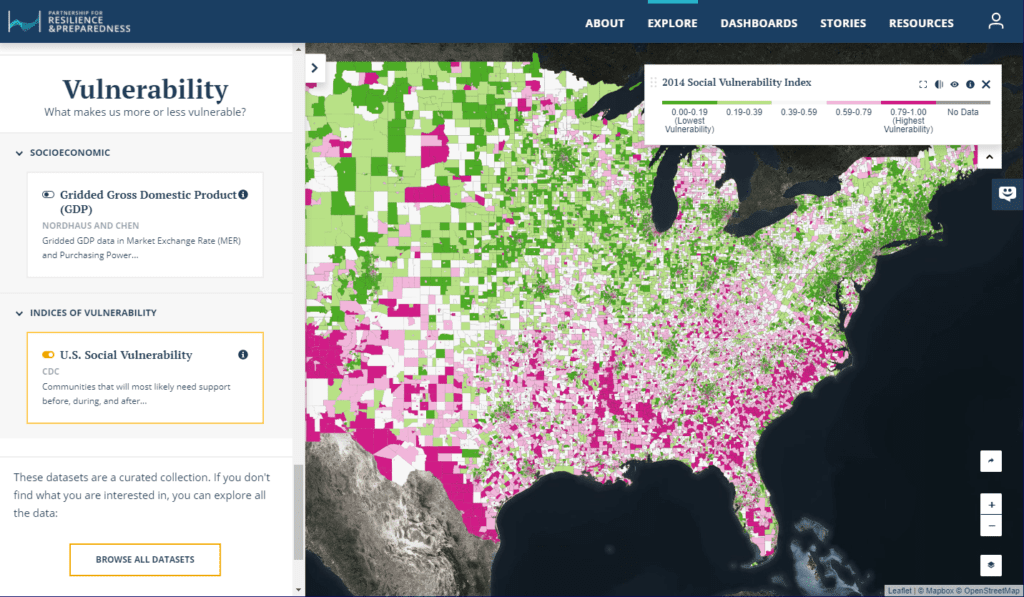
PREPdata, an open-source platform, seeks to improve access to useful data and empower communities and businesses to better plan for and build climate resilience.

Read more


(Image courtesy of Wikimedia Commons/Ramkumar)

Water shortages cost Indian energy companies billions based on new research from Water Resources Institute.

Read more

Global Water Risk Dashboard

SymGEO is pleased to share a free and interactive Global Water Risk Dashboard to help inform policy decisions on water risk and spark international discussion around the world. Powered by Esri’s ArcGIS dashboard technology, this configurable application is based on population data provided by CIESIN, overall water risk data from Water Resources Institute, and country boundary data from GADM.

From WRI: “Overall water risk identifies areas with higher exposure to water-related risks and is an aggregated measure of all selected indicators from the Physical Quantity, Quality and Regulatory & Reputational Risk categories. Physical risks related to quantity identify areas of concern regarding water quantity (e.g. droughts or floods) that may impact short or long term water availability. Physical risks related to quality identify areas of concern regarding water quality that may impact short or long term water availability. Regulatory and reputational risks identify areas of concern regarding uncertainty in regulatory change, as well as conflicts with the public regarding water issues.”

These data sets can be explored in detail in the WRI’s Aqueduct application.

The data was processed in ArcGIS Pro to aggregate the number of people in each country by overall risk category using zonal statistics. Once processed and symbolized, the data was then published and hosted in ArcGIS online, from which the Operation Dashboard was constructed. Charts and numerical summaries update interactively based on the map window extents, and clicking on a country of interest reveals detailed overall water risk data for that country.

Check out the Global Water Risk Dashboard today and let us know what you think!

News for January, 2018

SymGEO News is designed to aggregate and share relevant and timely stories of geospatial data advances from around the web, and around the world. Knowledge sharing in this age of information is critical to advance the science – leading to better decisions and more insightful stories. Join us by subscribing, and share your story with our community!

News for January, 2018


Image courtesy of www.jct600.co.uk

Smart Cities are embracing GIS to solve problems ranging from traffic to bad landlords using location-driven analytics and ground truthing.

Read more


Image courtesy of World Resources Institute and The Nature Conservancy

Planting trees as a business model? Studies show reforestation companies are profitable and are making a measurable positive impact on the environment.

Read more


Image courtesy of Tokyoahead at English Wikipedia

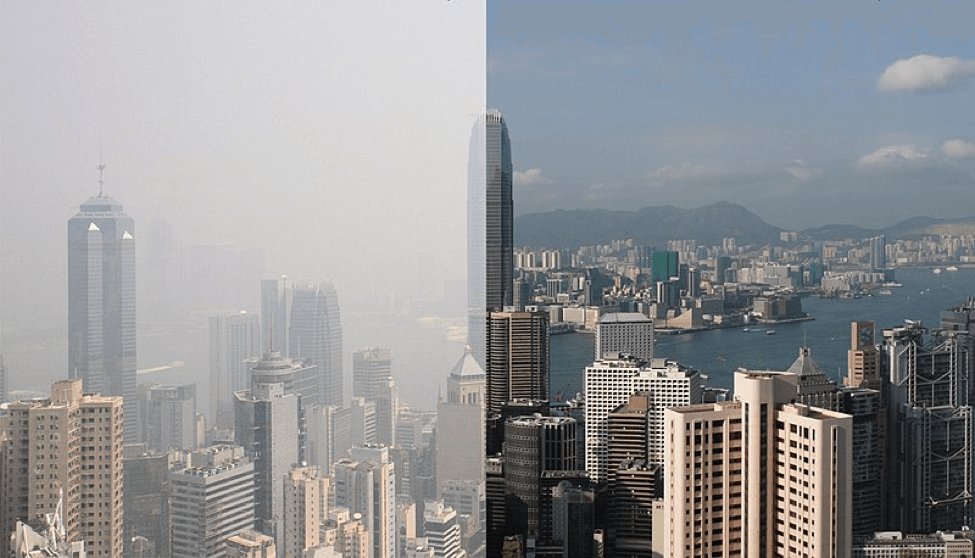
Air pollution costs businesses millions in lost revenues as consumers are more likely to stay indoors.

Read more


Image courtesy of Strava Labs

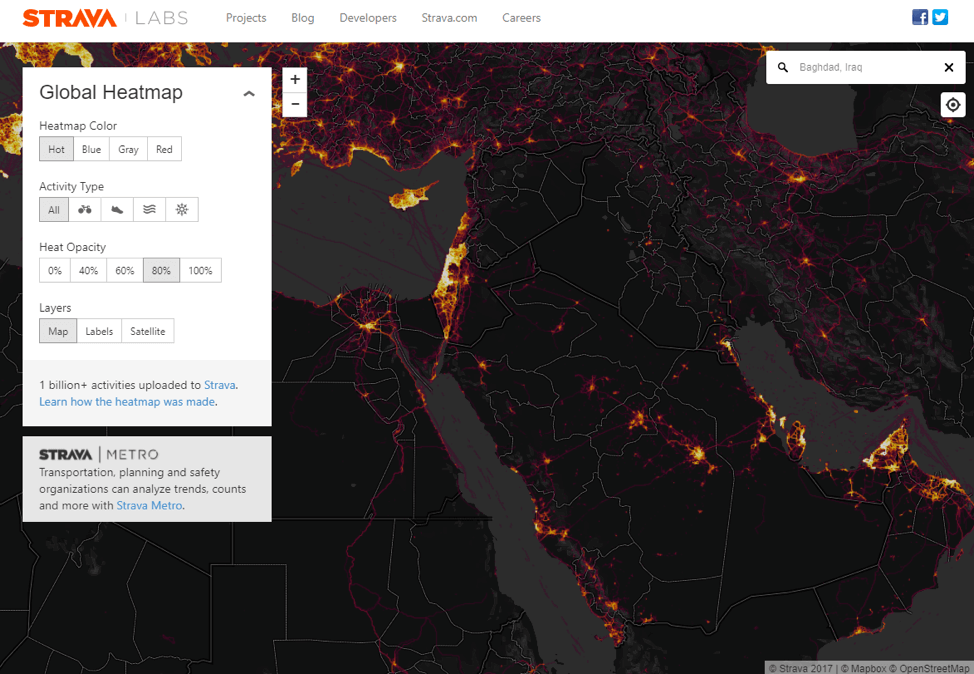
Strava global heatmaps show secret military bases as part of their user analytics, leading to the realization that big data visualizations may cause privacy concerns.

Read more