APTA Industry Footprint

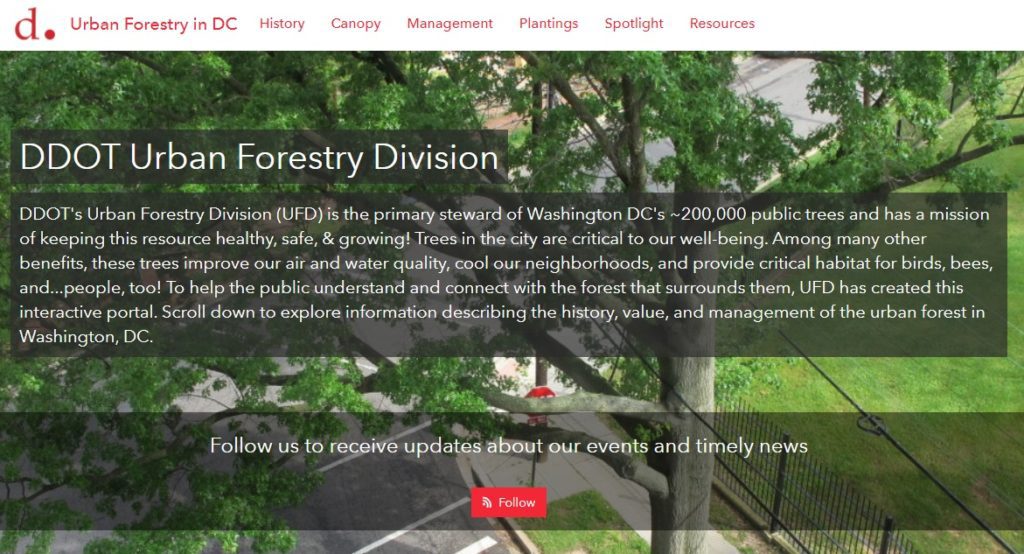
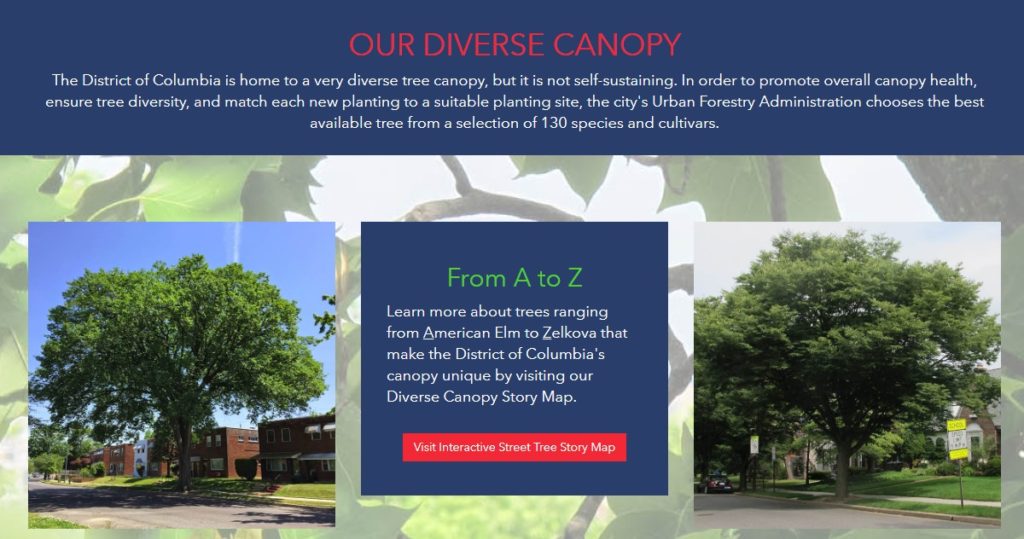
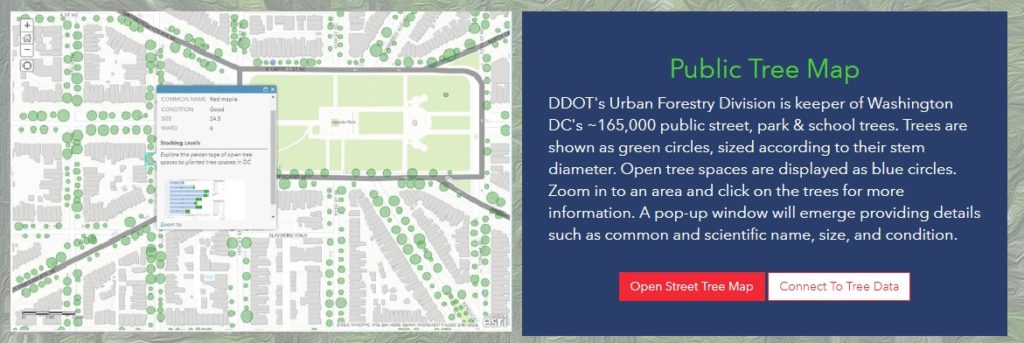
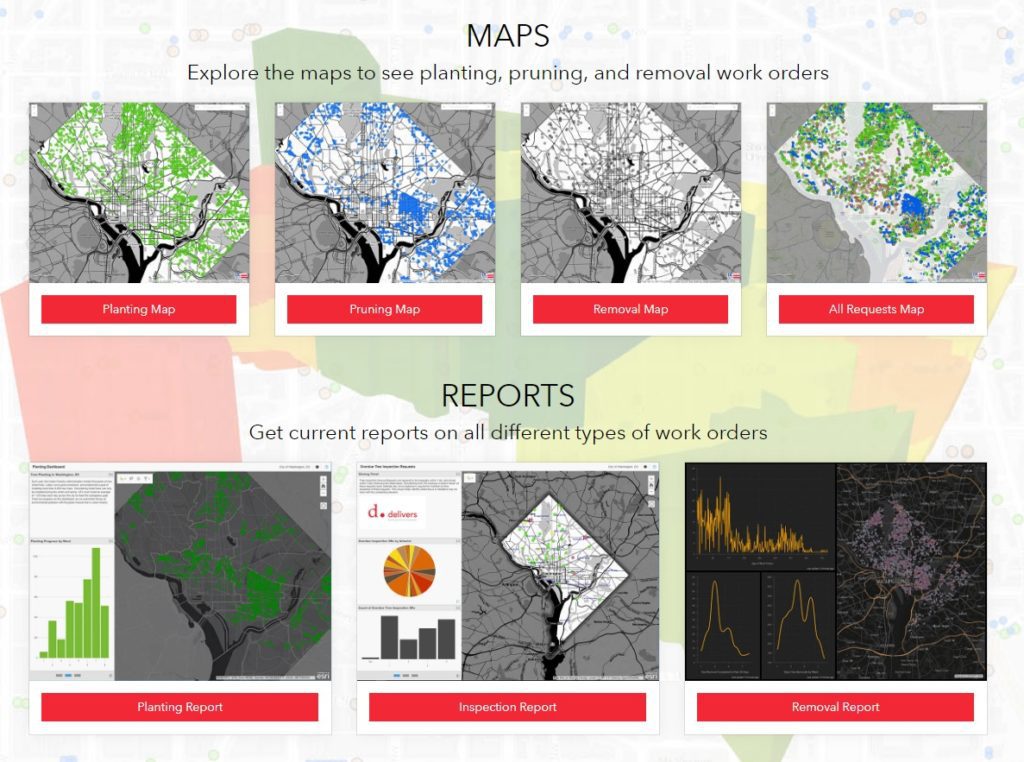
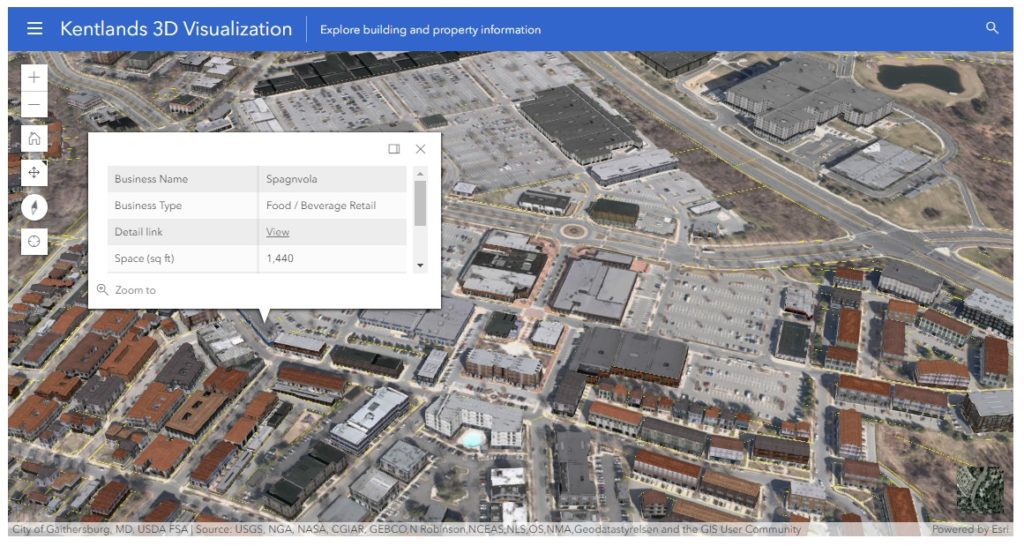
The SymGEO team was honored to redesign the flagship custom mapping application for the American Public Transportation Association (APTA) called the Industry Footprint. This application is designed to explore APTA membership, public transportation providers, transit service, manufacturing and supply chain, and congressional / legislative information. There is a wealth of information packed into one application!

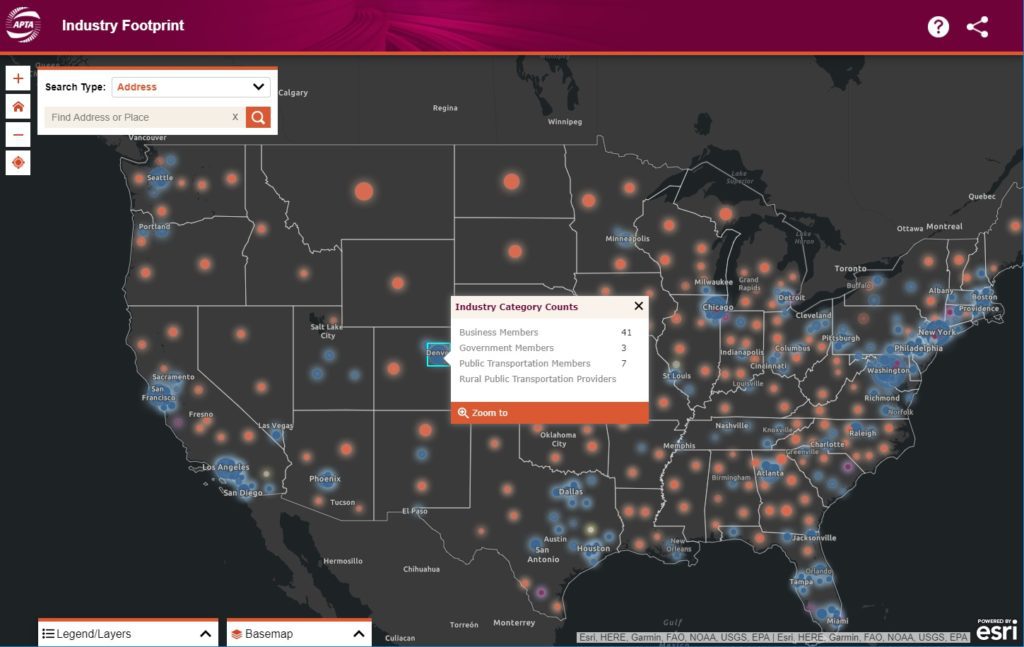
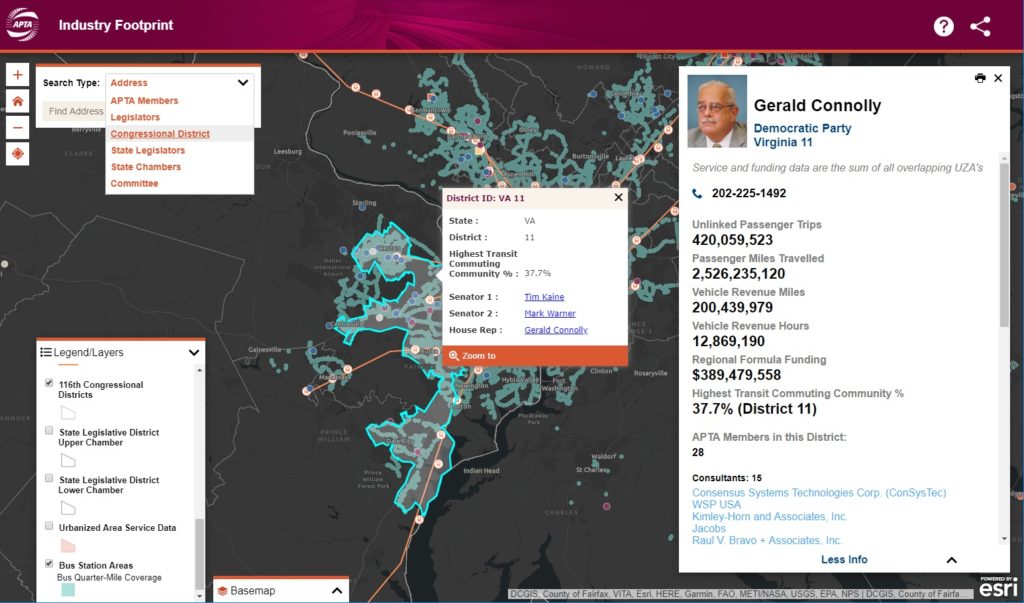
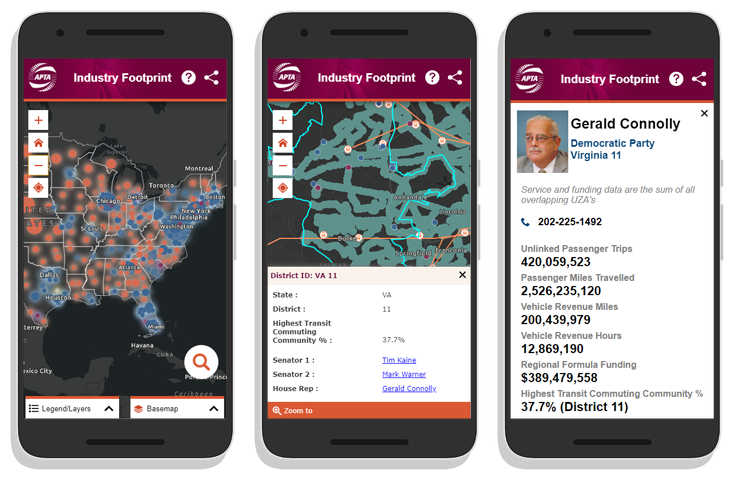
The newly modernized Industry Footprint first begins with a look at APTA membership and transportation provider data at the national scale. It’s not easy making intuitive sense of thousands of data points, but fortunately, there are visualization tools designed to help. SymGEO uses a novel cartographic predominance approach that shows the relative number of members and dominant industry category in each congressional district with a firefly symbology effect to give it a pleasing glow.

industry categories

“The SymGEO team worked on a tight schedule to deliver a series of impressive updates and fixes to our existing application, including a whole visual re-imagining. We are excited to work on even more innovations to the tool going forward together.”

–  APTA Senior Director, Policy Development and Research

State-wide information is provided upon zoom-in and includes details about the many APTA members, providers, bus and rail service areas, manufacturing supply chain, and legislative representative information. Most of these data sets required updates as part of this project, and several had broken over time as congressional data APIs had changed since the first version of this tool. This required extensive code logic updates and re-writes by our fantastic development partner, GeoMarvel, and included many stylistic and responsive updates to match the new modern design comps from our design partner.

statewide data

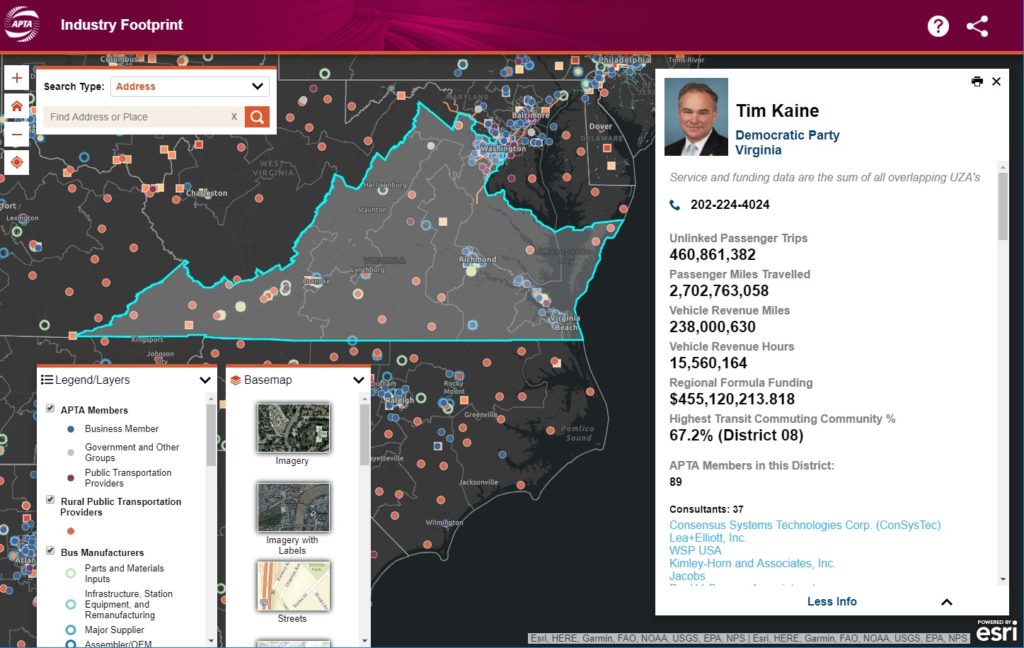
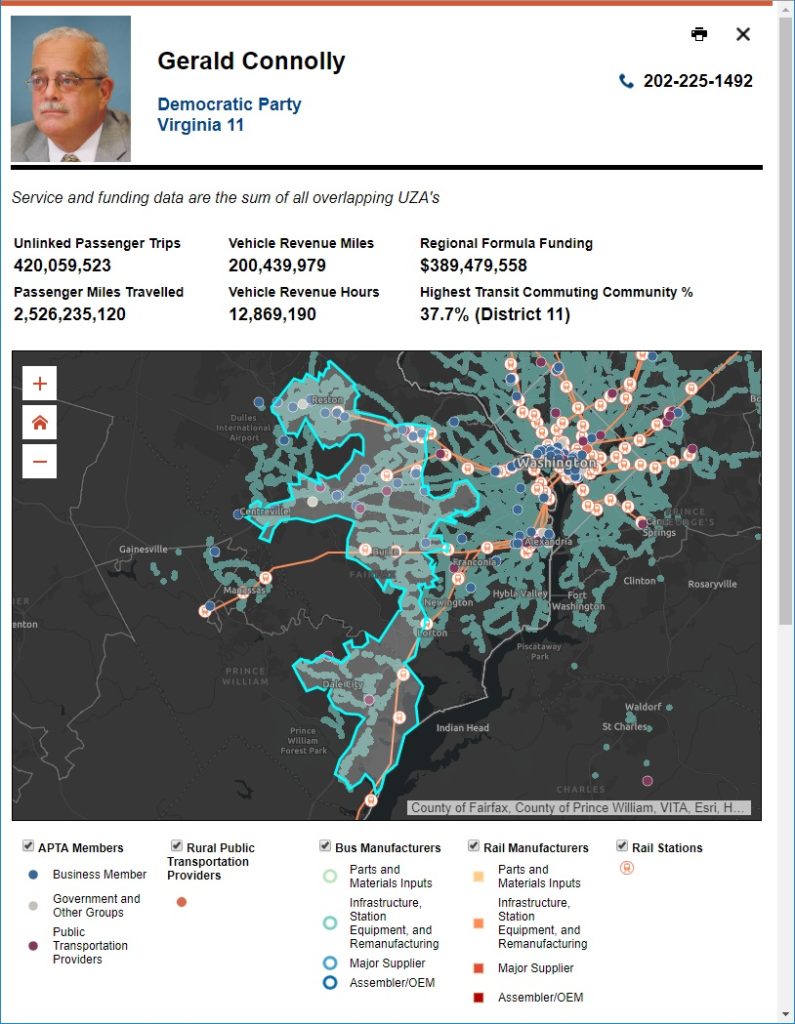
There are several search options available to help users find the information they are looking for and create the perfect map for their report or policy advocacy for their nonprofit work. For the detailed legislative information, users can locate their area of interest and select a congressional district or an upper / lower house state legislative district. Contact information is provided for the appropriate representative as well as a snap-shot of transit facts and membership data pertinent to that area.

congressional data

Print-ready interactive reports are also offered for the convenience of researchers who need to share their findings with others, either as digital pdfs or hard-copy prints.

printed report

Finally, the application was redesigned for a fluid and responsive mobile experience. This allows data access on the go, in a meeting, or wherever needed.

APTA mobile

Talk to our mapping application experts today if you have an aging custom application that needs some modern TLC – the SymGEO team is here to help!

Downtown: Energize! in ArcNews

SymGEO was honored to have our community engagement pilot project Downtown: Energize! Kentlands featured in the 2019 ArcNews Spring edition!  This premier hard-copy and digital publication by Esri has a circulation of 900,000 industry professionals and is a go-to source for all that is new and innovative in the Esri GIS community.

This wonderfully in-depth article examines the purpose and need of the site, the benefits brought to residents and businesses, and of course, the amazing Esri technology that makes it all possible.

Check it out, and let us know if your community would like to experience the positive power of Downtown: Energize!

DDOT Urban Forestry Division Hub

SymGEO is pleased to announce the launch of the DDOT Urban Forestry Division Hub! This new digital platform is designed to engage and interact with the DC community and provide information about the many services and resources offered by the Urban Forestry Division (UFD) of the District Department of Transportation (DDOT). This digital platform was built using Esri’s ArcGIS Hub technology, in coordination with OCTO and Open Data DC.

With a long history of caring for the extensive forest canopy in DC, the Urban Forestry Division has meticulously assembled data sets and applications to help in their forest management mission and to communicate with a variety of audiences. With the introduction of Esri’s ArcGIS Hub technology, there is finally a digital platform perfectly designed to tie all the pieces together into a cohesive story. SymGEO was honored to be approached by the Urban Forestry group to help them design, configure, and deploy this comprehensive digital solution.

“SymGEO is a remarkably flexible and responsive company. They listen carefully to requirements and deftly blend customer vision with technological capabilities.”

DDOT Associate Director / State Forester, Urban Forestry Division

The urban forest story begins with a look to the past and introduces the audience to the long history and important role of trees in DC.

history

The story then turns to the impressive variety of trees available for public enjoyment and leverages several applications and digital stories that the urban forestry group has already developed.

canopy

The flagship data set of the Urban Forest group is the Public Tree Map which elegantly displays a tremendous amount of current information about the urban tree canopy. Links are provided to both the map and the underlying data for the community to use and explore.

public tree map

Work orders, permits, inspections, plantings, removals… there’s a lot going on in Urban Forestry! Fortunately, many data sets and reporting mechanisms have been developed to keep track of it all. These have now been shared with the public under one digital roof for a better understanding of agency scope and status.

urban forestry maps

Of course, what fun are statistics if they can’t be updated on the fly as new information is entered into databases behind the scenes?

stats

Finally, links to tools and resources are provided for partners and stakeholders to begin making their own applications and discoveries with DC government data.

tools

Talk to our industry experts if your agency or organization is interested in leveraging the power of Esri’s ArcGIS Hub – SymGEO is here to help!

Croatian Rail Network

SymGEO is pleased to announce the completion of a project with The World Bank Group that enables valuable interactive insight into the rail transportation system in Croatia. This project has since been featured by Esri as a Case Study for dashboard best practices, and then featured in ArcNews as a success story entitled “World Bank Deploys GIS Dashboard to Improve Railway Safety in Croatia“.

This project started from humble beginnings, with a series of excel files that detailed rail segment speed, passenger numbers, freight volumes, age of the track, and other characteristics.

croatia excel file

SymGEO then used a schematic diagram of the network to build and calibrate a spatially accurate network based on OpenStreetMap rail data and linear referencing of station locations.

croatia network diagram

This newly created spatial data was then hosted in ArcGIS Online and used to configure an ArcGIS Dashboard application. This application was specifically designed to filter and query the data interactively on demand and present summary statistics based on complex queries. This combination of attribute queries, summary statistics, and visual representation now enables report graphics and key decision data to be created on-the-fly by the client.

“This is superb and exactly what the client needed and what I was imagining.”

– World Bank client

If you have complex transportation network data that you’d like to leverage with an intuitive, user-friendly, configurable application, then SymGEO would love to hear from you!

SymGEO Hub in the News

This month we were honored to have Downtown: Energize! featured in two local papers. There has been tremendous energy and enthusiasm swirling around this flagship project from SymGEO, and the technology continues to improve with every update.

lakelands newspaper

Downtown: Energize! features many different components of the ArcGIS technology suite, including Survey123, GeoForm / Collector, ArcGIS Dashboard, Web AppBuilder for the retail locator, and a web scene that uses CityEngine textured models derived from building footprints and Lidar information processed in ArcGIS Pro. These components are then hosted in ArcGIS Online and leveraged using ArcGIS Hub technology.

downtown energize banner

Two local development boards, the Kentlands Downtown Working Group (KDWG) and the One Main Street Initiative (OMSI), took an excited interest in Downtown: Energize! and have commissioned complimentary sites to be built using Hub technology. The commercial real-estate management of the site is especially useful in a fast-paced environment!

kentlands newspaper

“The KDWG was commissioned by the Kentlands board to provide accurate and timely information on the various development efforts going on with our downtown so residents can be better informed and take a more active role in improving our community. We chose the Downtown: Energize! platform developed by SymGEO with its innovative digital mapping because it helps do exactly that.”

– John Ingrassia, Chair, Kentlands Downtown Working Group

“A great commercial district is a huge amenity for our community. Downtown: Energize! is a great digital tool for helping the community achieve the vision for our commercial district. Not only will it help us engage the community to provide flexible two-way dialogue, but it will help us by mapping opportunities where businesses can expand and thrive. This innovative platform will allow us to easily update data, access data and provide data well beyond our community, which provides outreach to businesses looking to expand. Additionally, it is a fun way to empower consumers looking for a place to spend their precious free time to engage with this easy to use tool whether at home or mobile. Working with Kevin at SymGEO has been an amazing experience. He and his team are bringing tremendous innovations and ideas to our team at The One Mainstreet Initiative.”

– Neil Burka, Chair, One Main Street Initiative

“I was so excited when SymGEO came to us with this idea. As a local real estate agent and resident who is deeply engaged in the community, I understand on a personal level how important this spatial data is to get the community engaged and onboard with what’s happening. This platform will make it easy to access the data – especially for folks who, like me, are more visual.”

– Sheena Saydam, Realtor, Keller Williams Capital Properties, Member, Kentlands Downtown Working Group

“Downtown: Energize! as created by Kevin McMaster using the SymGEO platform, is an innovative digital tool that provides mapping of business locations to potential and existing customers in a format that is fun, easy to use, and flexible enough to accept updates and even track current events. It’s a win-win for our community by empowering residents to engage with our local businesses and to energize our downtown!”

– Ingrid L. Fraley, Local Business Owner – Design Services, Inc.

kentlands 3d

If you’d like to join the party with a Downtown: Energize! initiative, let us know as SymGEO is here to help!

Hurricane Tracker

With Hurricane Florence rapidly approaching the Carolinas, the scale and power of the storm was truly terrifying. From eye of the hurricane video, provided by the NOAA Hurricane Hunter (9 second mark below), to overhead imagery from NOAA showing the churning vortex, it was only a matter of time before the devastating effects of the hurricane would be felt.


Armed with Esri technology and the thirst for knowledge, SymGEO explored the Living Atlas of the World data sets until we found The National Digital Forecast Database (NDFD).

“The NDFD was designed to provide access to weather forecasts in digital form from a central location. The NDFD produces gridded forecasts of sensible weather elements. NDFD contains a seamless mosaic of digital forecasts from National Weather Service (NWS) field offices working in collaboration with the National Centers for Environmental Prediction (NCEP). All of these organizations are under the administration of the National Oceanic and Atmospheric Administration (NOAA). Wind Gust is the maximum 3-second wind speed (in knots) forecast to occur within a 2-minute interval at a height of 10 meters. Wind gust forecasts are valid at the top of the indicated hour. This feed consumes NDFD’s files and calculates the amount of forecast wind gust for the next 72 hours.”

– from NDFD metadata

This information was explored in ArcGIS Online and showed the scale and timing of the expected hurricane landfall.

animated hurricane data

Finally, this data was wrapped in a time-aware, mobile responsive template in ArcGIS Online and tested to make sure it was pulling current data.

hurricane tracker phone

Check out the Hurricane Tracker today and let us know if you have an idea that SymGEO can help you with!

Land Area by Zoning

Ever wonder how much land area there is in DC by zoning district or specific zone? Well, wonder no more, as we sliced and diced the data, and created the DC Land Area Explorer by Zoning Type. This application leverages Esri‘s select by chart category functionality in ArcGIS dashboard. Data is kindly provided by our friends at DC Office of Zoning (DCOZ),  the Department of Consumer and Regulatory Affairs (DCRA), and a fabulous basemap by OCTO’s DCGIS team.

Users can select zoning categories or specific zones by clicking on the bars in the charts. This will update the total recorded land area calculation to just the selected zone(s). Alternatively, for really detailed analysis, zooming into the map and using the “select” tool in the map window allows the selection by zoning district, specific zone, or even property boundaries.

Take a look at the DC Land Area Explorer by Zoning Type, and if you have data you’d like sliced, diced, sauteed or… you know who to contact!

Commercial Property Management

Keeping track of who is where, what’s coming soon, square footage available, and when leases are ending can be quite a challenge when hundreds (or thousands!) of properties are involved. Fortunately, GIS is perfectly suited to this task of commercial property management, as it combines space, time, attributes and symbology into one cohesive picture.

For the Kentlands community in Gaithersburg, MD, ArcGIS Online data was used to power an initiative called Downtown: Energize!, that has garnered critical acclaim from residents and business owners alike. This Hub site designed to explore existing retail, gather community ideas, and identify opportunities for commercial business. With almost a hundred commercial properties involved, including several large commercial parcels, the data came in the usual assortment of formats (pdf, GIS, field collection). However, the end result was a cohesive framework designed to be updated and informed by the community it serves through a crowd-sourced GeoForm application.

data updater

geoform

Searching by business name was enabled through a configurable application that is embedded into the Hub site. There is also active development and building reconfiguration occurring in this area, as shown below with the current buildings overlaid on last year’s imagery. This solution provides a one-stop shop for information about current commercial businesses in the area, and a common platform for the community to use.

If your community is ready to get started with a Downtown: Energize! initiative or your business would like to use GIS as a property management tool, let us know as SymGEO is here to help!

Sledding Locator

Sledding and July don’t usually go together, but what better time to plan out the winter’s adventures? This is the quintessential example of an idea that took 6 months to mature and then a few hours to accomplish, thanks to the power of Web AppBuilder and Landscape Modeler.

Like all great solutions, I was trying to do something else (boring technical details redacted), but happened on the Landscape Modeler which had most of the needed architecture already in place. By wrapping the model into an application configured using Web AppBuilder, the Sledding Locator was created in a matter of hours.

Sledding Locator

This application leverages a weighted raster overlay (WRO) model that specifically targets northern-facing sloped areas with roads in the general vicinity. When combined with some of the other basemap layers, particularly imagery to see if it’s relatively open lands, users will be able to tell if it’s worth scouting out for sledding potential following a snow-storm!

Landscape Modeler

From the technical Esri documentation: Weighted overlay has three conceptual steps. First, each raster layer is assigned a weight, as a percentage, in the analysis. This allows you to emphasize the relative importance of each layer in the analysis. Second, values within each raster layer are mapped to a common suitability scale. This allows you to compare the different types of information in each raster layer. Third, all raster layers in the analysis are overlaid. Each raster cell’s suitability value is multiplied by its layer weight and totaled with the values of other raster cells it overlays. The result is a suitability value that is used for symbology in the output raster layer.

Two input rasters have been reclassified

A number of other handy tools are included in this mobile responsive application so users can add their own data, add map annotations (drawings and text), or share the application with their friends.

Check it out today and let us know if you have an idea that SymGEO can help you with, or send us pictures of awesome hills you’ve found with the app!

Waze Traffic in DC

Waze and Esri recently announced an expanded partnership, giving cities easier access to traffic conditions data and incident reports. Esri also has a traffic layer updated every 5 minutes, with road closure notices and other important information included. By combining these near real-time data sources with the marvels of modern technology, SymGEO is pleased to unveil the DC Traffic Dashboard.

Use the DC Traffic Dashboard to plan your commute, see what’s in store, or enjoy your day of telework that much more! Contact SymGEO for more info or for your own handy-dandy dashboard.