Public transportation is a $79 billion industry that employs 430,000 people and supports millions of private-sector jobs. As the public transportation industry advocacy leader, the American Public Transportation Association (APTA) is dependent on accurate, current data to help inform critical decisions. The newly updated Industry Footprint is designed to collect, analyze, and present key statistics at national, state, and local levels. This application, produced in collaboration with our development partners at GeoMarvel, provides insight into APTA membership, public transportation providers, transit service, manufacturing and supply chain, and congressional/legislative contact information. Learn more about all the innovative platform enhancements in the APTA Industry Footprint Storymap.
“The SymGEO team worked on a tight schedule to deliver a series of impressive updates and fixes to our existing application, including a whole visual re-imagining. We are excited to work on even more innovations to the tool going forward together.”
– APTA Senior Director, Policy Development and Research
Would a custom mapping application like this be useful to your organization? Talk to our solution experts today about your unique GIS needs, the SymGEO team is here to help!
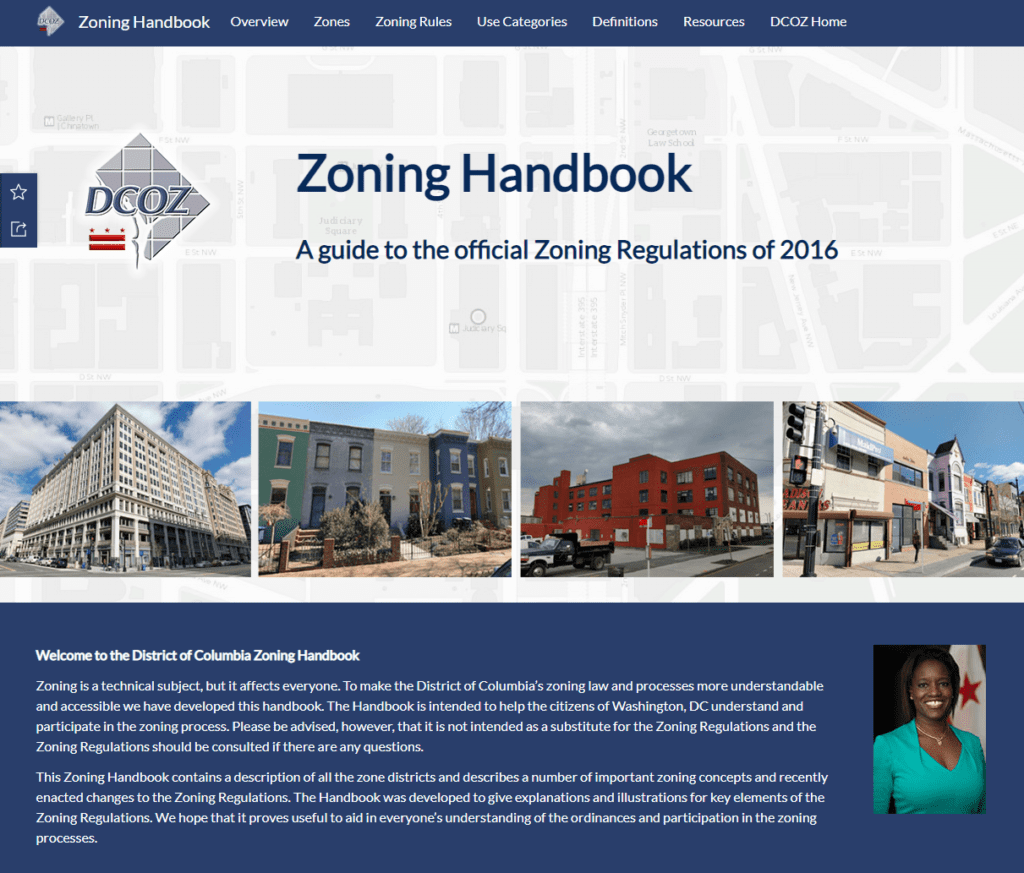
The District of Columbia Office of Zoning (DCOZ) is responsible for communicating zoning rules and regulations to District residents. To facilitate this flow of technical information, DCOZ partnered with SymGEO to develop the next-generation DC Zoning Handbook, built using ArcGIS Hub technology.
“The Zoning Handbook is an important resource for District residents to understand and participate in the zoning process. We enjoyed working with SymGEO to migrate existing content, leverage current technology, and develop new solutions to make the process as easy as possible for our audience.”
– Director, DC Office of Zoning
The Zoning Handbook was designed to start at the highest level of information and introduce the concepts and locations of zoning categories.
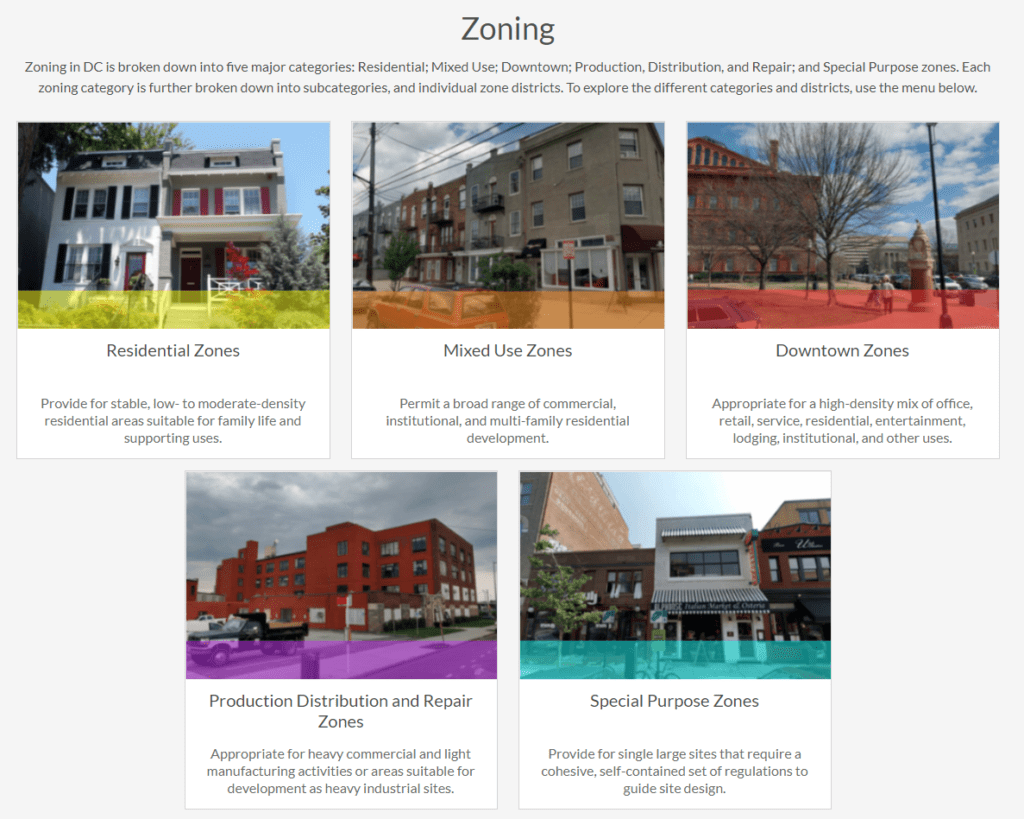
Selecting a general zoning category (such as Residential) drills down into the types of residential zoning in the District.
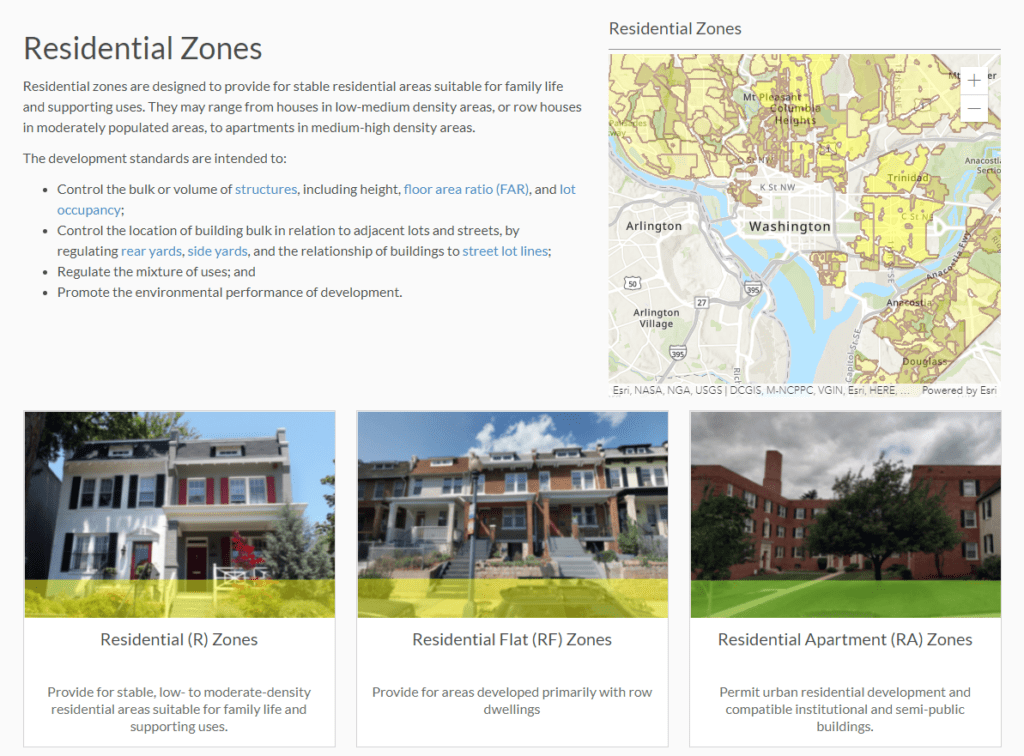
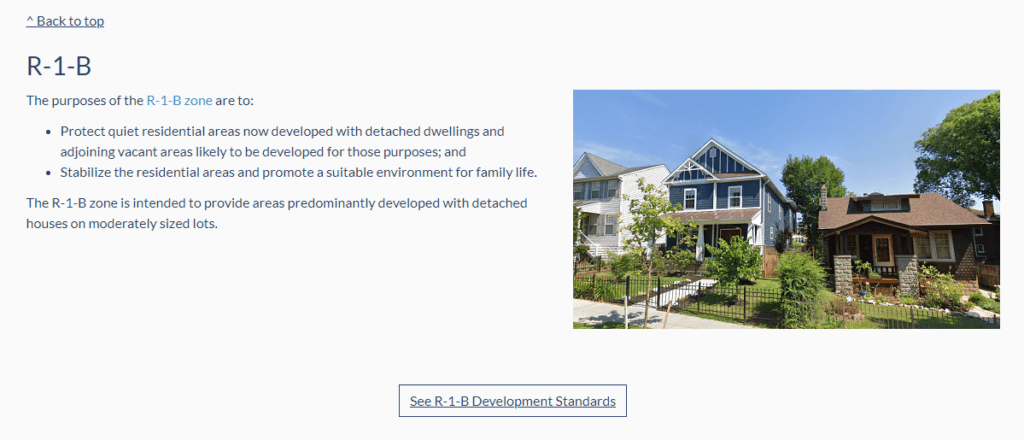
Selecting a type of residential zoning delves into the purposes and intentions of the many variants within that particular zoning type.
At this final level of detail, the development standards for the specific zone are offered using a Development Standards Dashboard, developed using ArcGIS Dashboards, which communicates the technical aspects of the zoning type in a mobile-responsive format.
“The ArcGIS Hub cloud platform enabled us to augment the zoning regulations with interactive dashboards and maps to provide an engaging and informative experience while reducing the need for on-premise servers and applications.”
– Data Coordinator, DC Office of Zoning
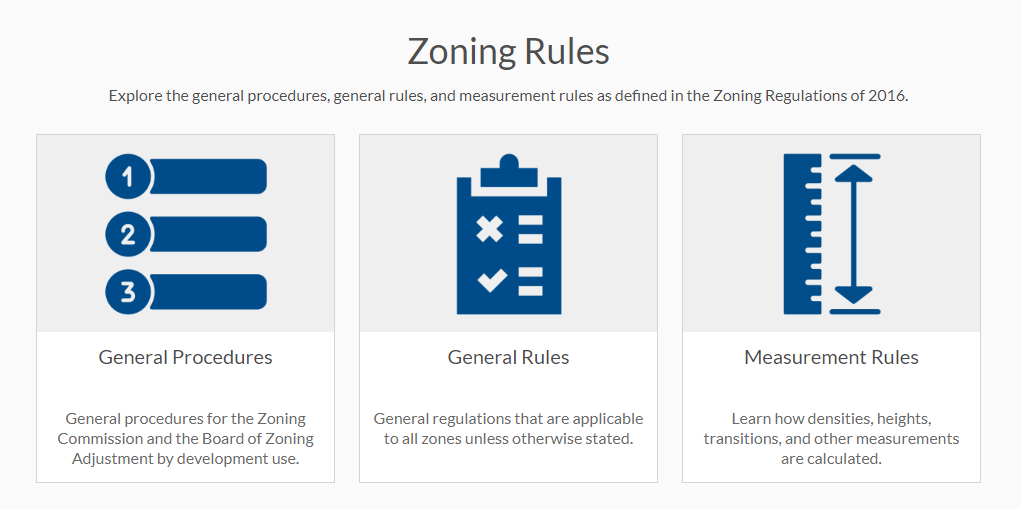
Back on the main page of the Zoning Handbook, insight can be found into the general procedures, general rules, and measurement regulations as defined in the Zoning Regulations.
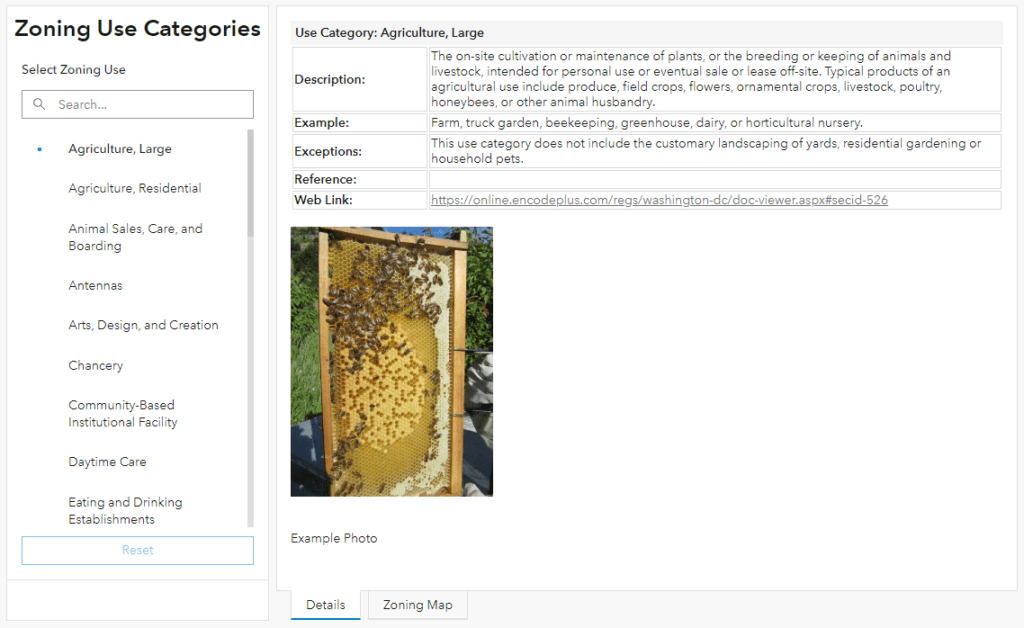
Zoning Use Categories are presented using ArcGIS Dashboard technology in a mobile-friendly format.
A long list of definitions helps District residents navigate the language used in the zoning regulations.
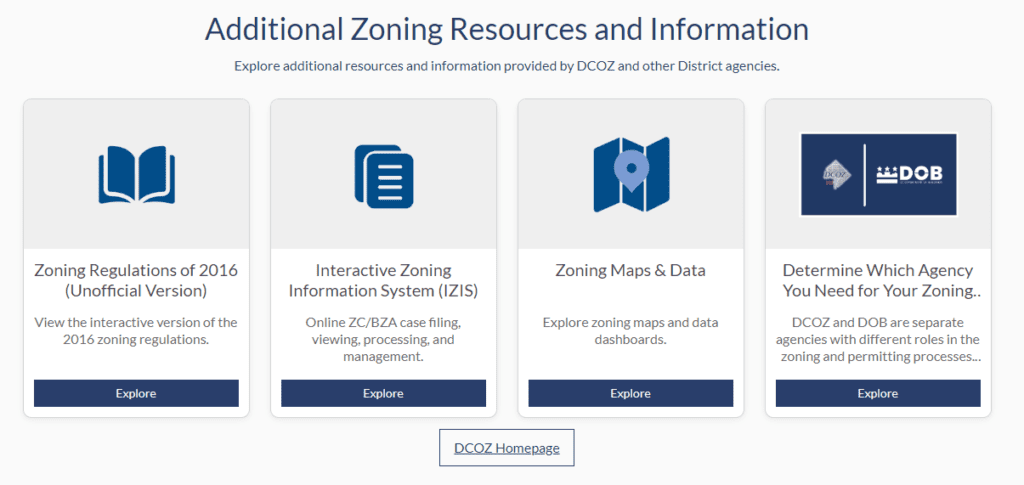
Finally, additional zoning resources and information are offered for further reading and zone exploration.
Talk to SymGEO today if your municipality or agency is interested in migrating web content to an ArcGIS Hub solution – we are certified experts and are here to help.
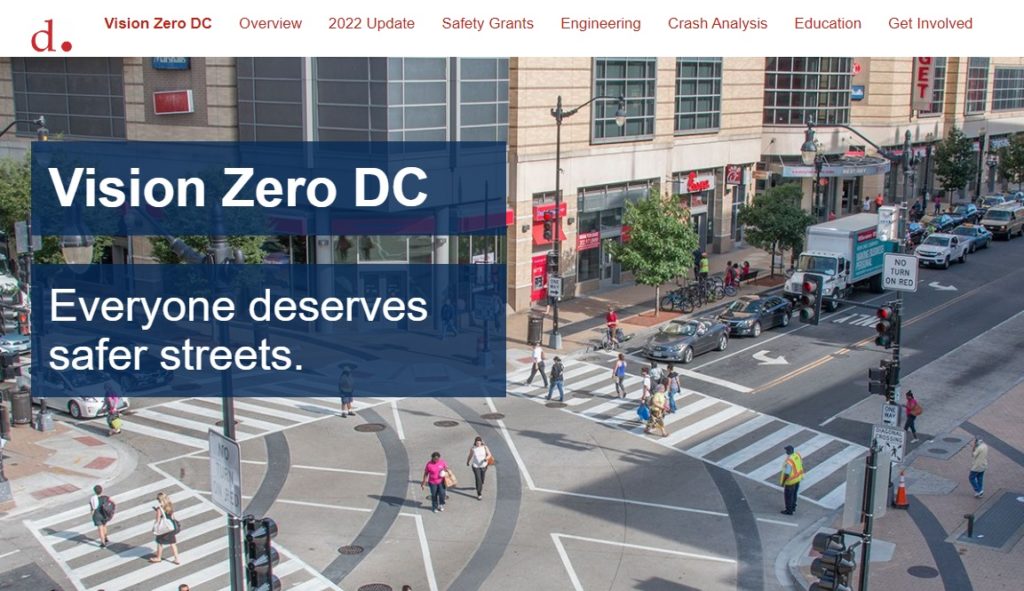
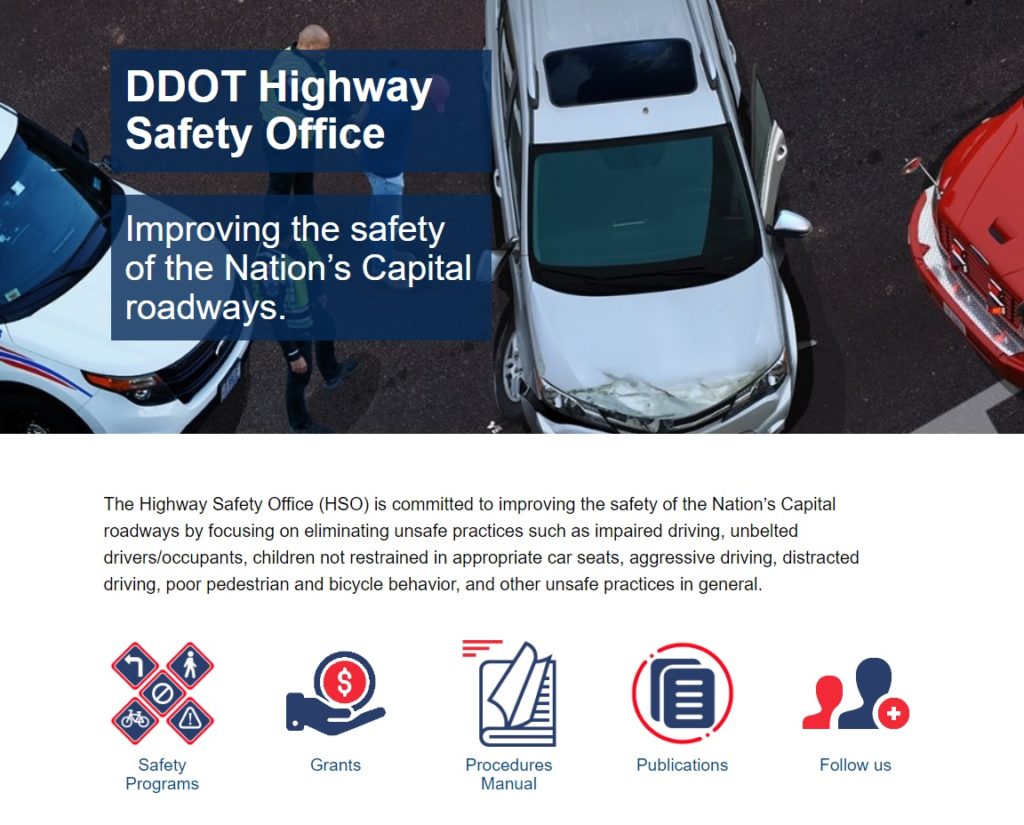
District of Columbia Mayor Muriel Bowser launched Vision Zero in 2015 to inspire and transform DC’s roadway safety efforts and to set DC’s sights on a goal of zero fatalities or serious injuries on District streets. Since then, the District Department of Transportation (DDOT) has shifted to designing streets that are safe for everyone, working closely with community members to identify problems and build solutions. As part of a new community outreach effort, SymGEO was honored to help DDOT build the new Vision Zero DC website using ArcGIS Hub technology. Read the official press release from DDOT for this exciting website launch, as well as the comprehensive ArcNews article entitled “Washington, DC, Pursues Equity and Transparency in Vision Zero Campaign” featured on the front page of the Spring 2023 edition.
“The new Vision Zero DC website will help us work closely with community members to identify problems and build solutions. SymGEO iterated quickly and efficiently on design ideas and built a very engaging platform solution for DDOT.”
– DDOT Vision Zero Director
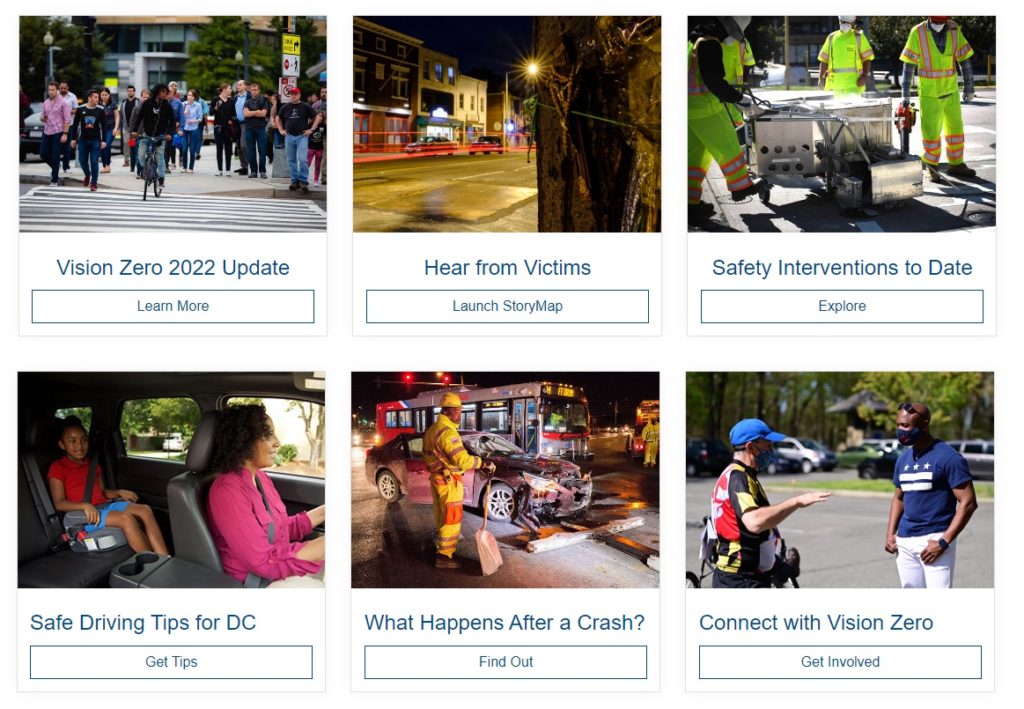
The Vision Zero DC site is organized into easily navigable sections based on audience interest and is designed to be mobile-responsive and broadly accessible.
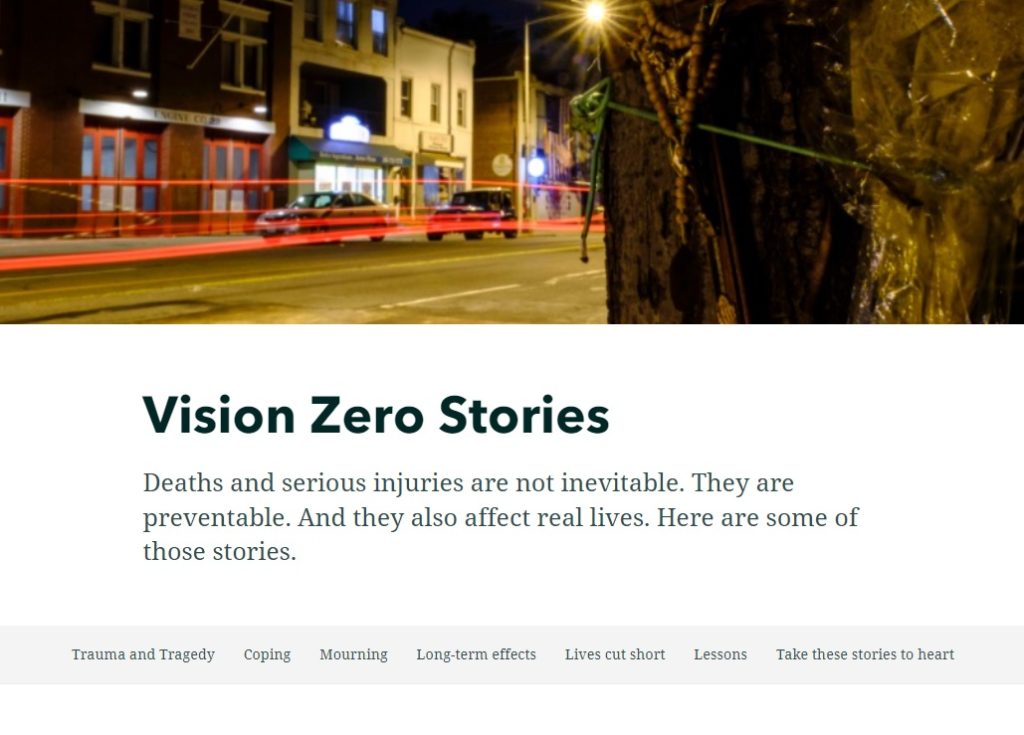
A poignant look at the human costs of dangerous driving and unsafe behaviors is presented in Vision Zero Stories, developed using ArcGIS StoryMap technology.
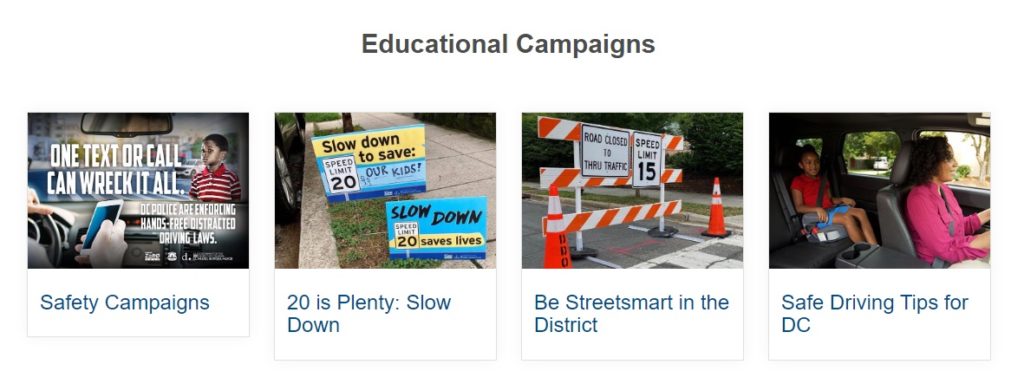
The Education page features educational campaigns that help to promote safe driving and pedestrian habits throughout the District.
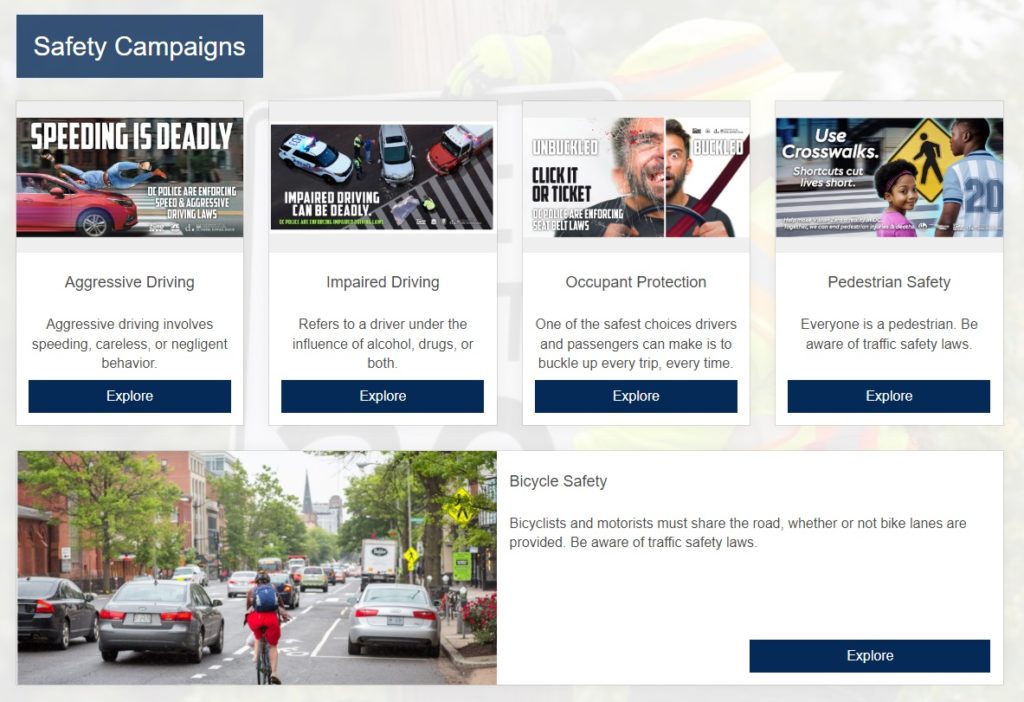
The safety campaigns target the biggest threats to the most vulnerable travelers on DC’s roadways. These include aggressive driving, impaired driving, occupant protection, pedestrian safety, and bicycle safety.
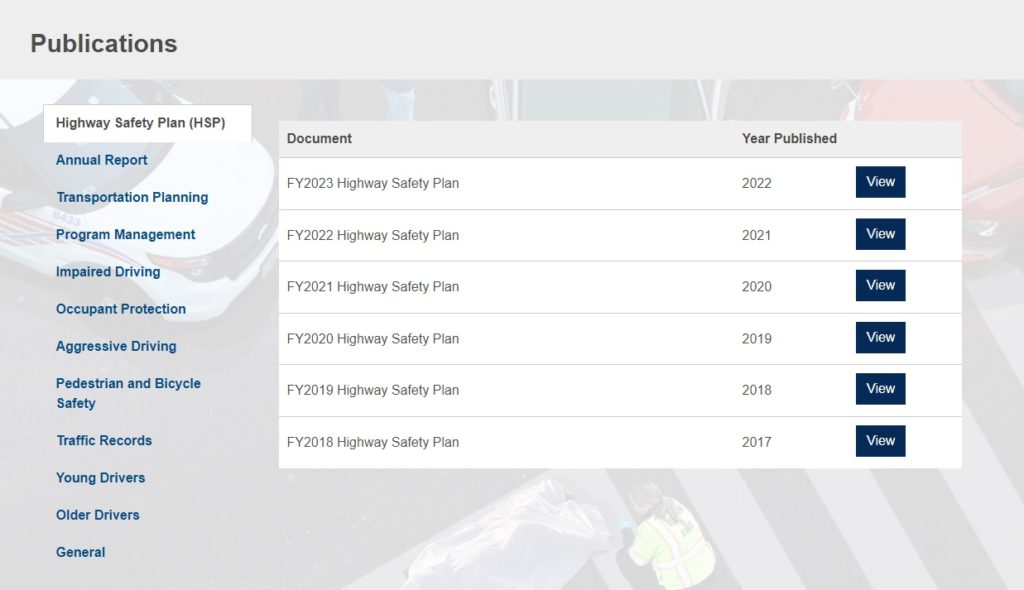
A link is also featured to Safety Grant information housed on DDOT’s Highway Safety Office page. This page also includes many links to safety programs, grants, procedure manuals, and publications.
This living document provides links to numerous helpful documents and publications.
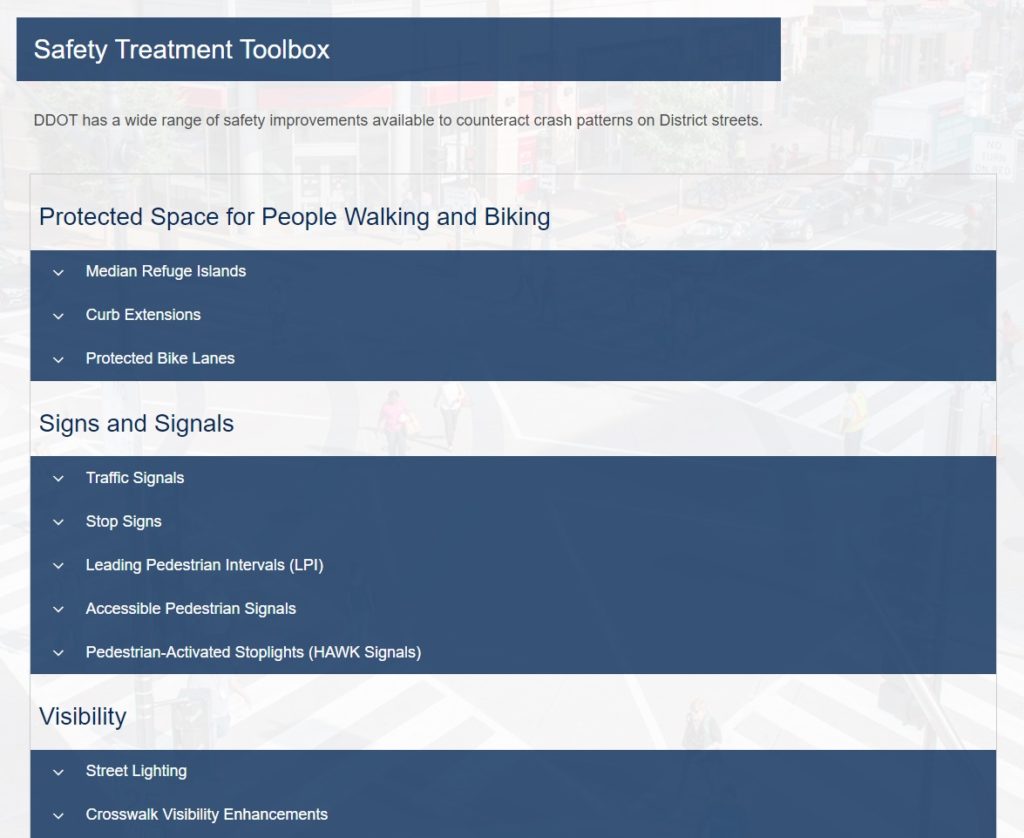
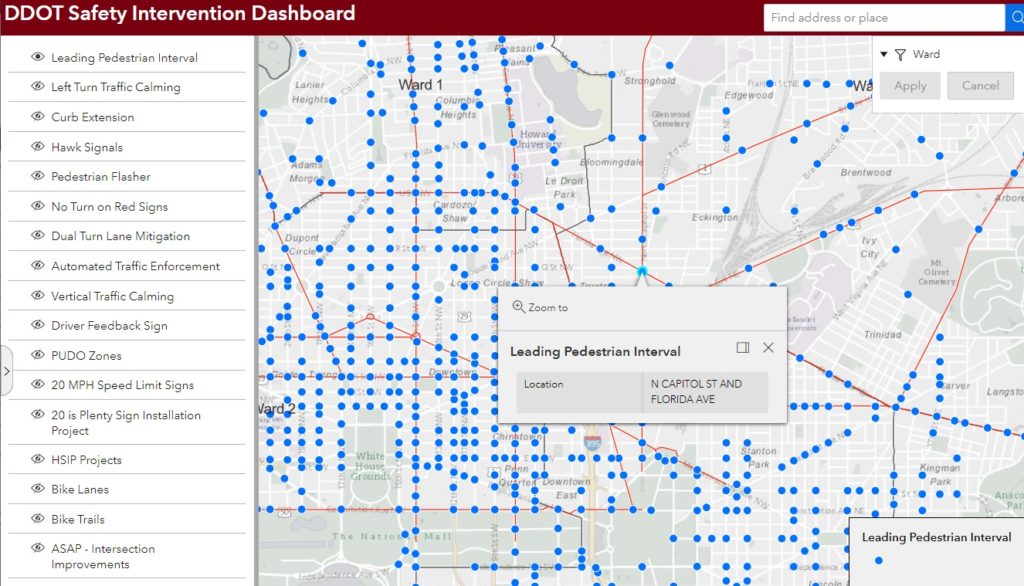
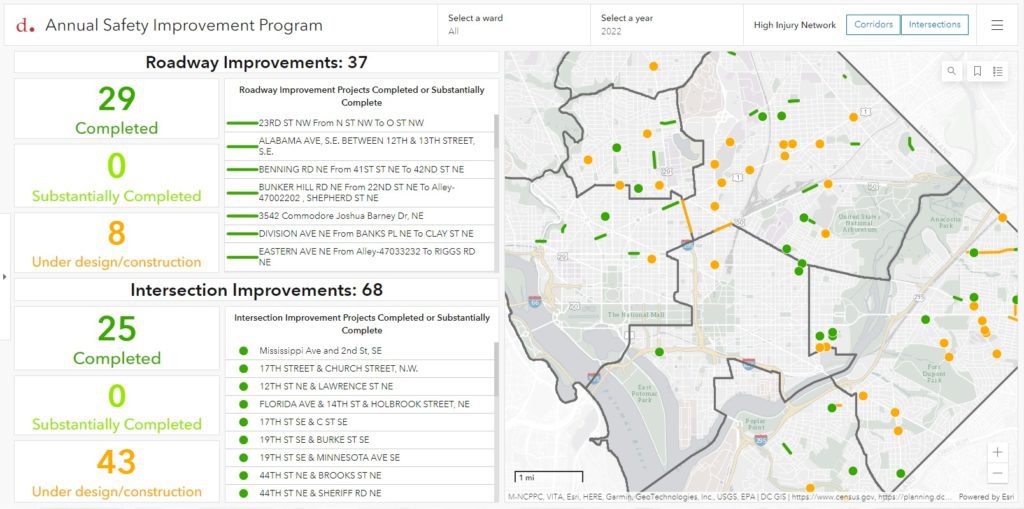
A look at the Engineering page shows the significant progress made in designing solutions to benefit vehicular and pedestrian traffic, conveniently organized into a Safety Treatment Toolbox.
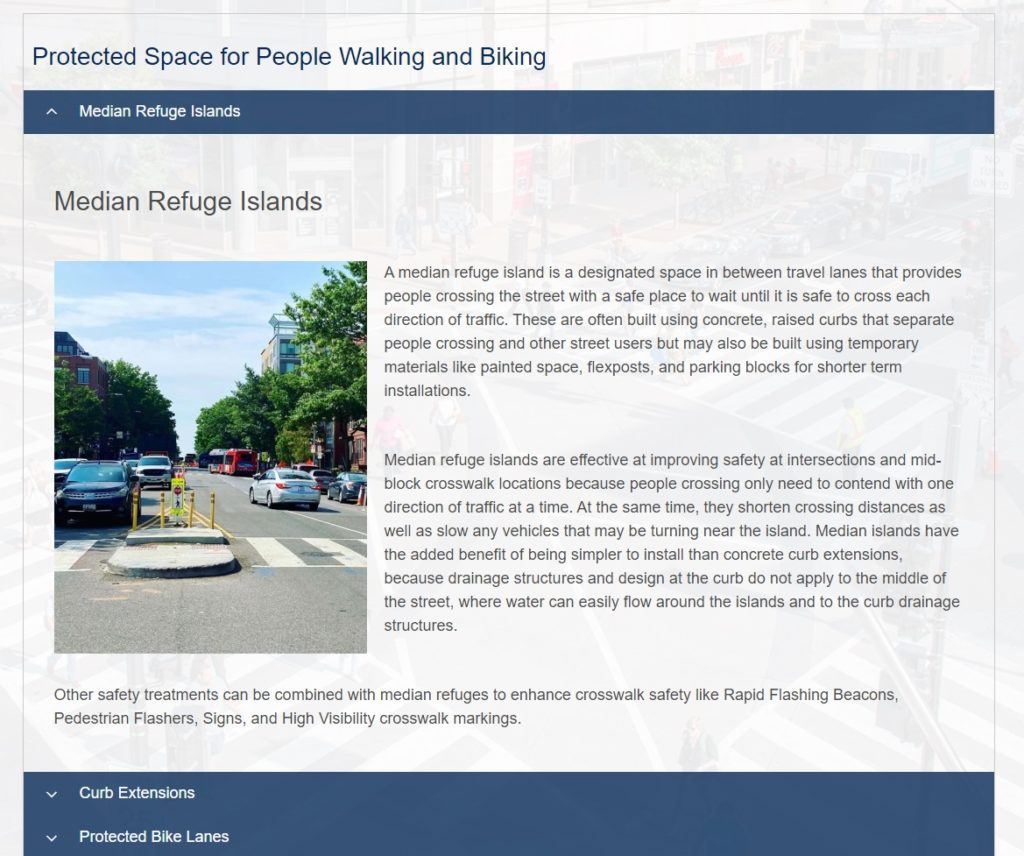
Expanding a section of the toolbox gives a wealth of information about each treatment “tool.”
A Safety Intervention dashboard gives insight into all the implementations of the safety toolbox tools that have occurred to date.
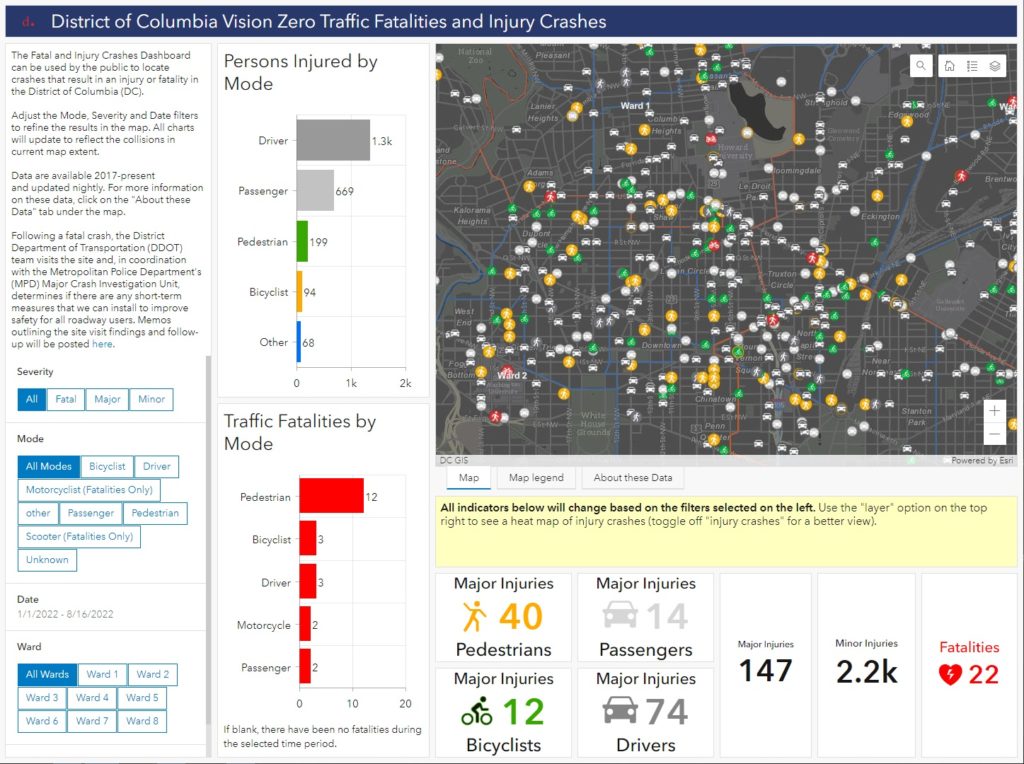
Exploring the Crash Analysis page gives a deep dive into the data fueling the push for zero fatalities on D.C.’s roadways, including a Fatality and Injury dashboard with authoritative data provided by the Metropolitan Police Department.
Talk to SymGEO today if your municipality or agency is interested in setting your sights on a goal of zero fatalities on your roadways using a Vision Zero hub site – we are certified experts and are here to help.
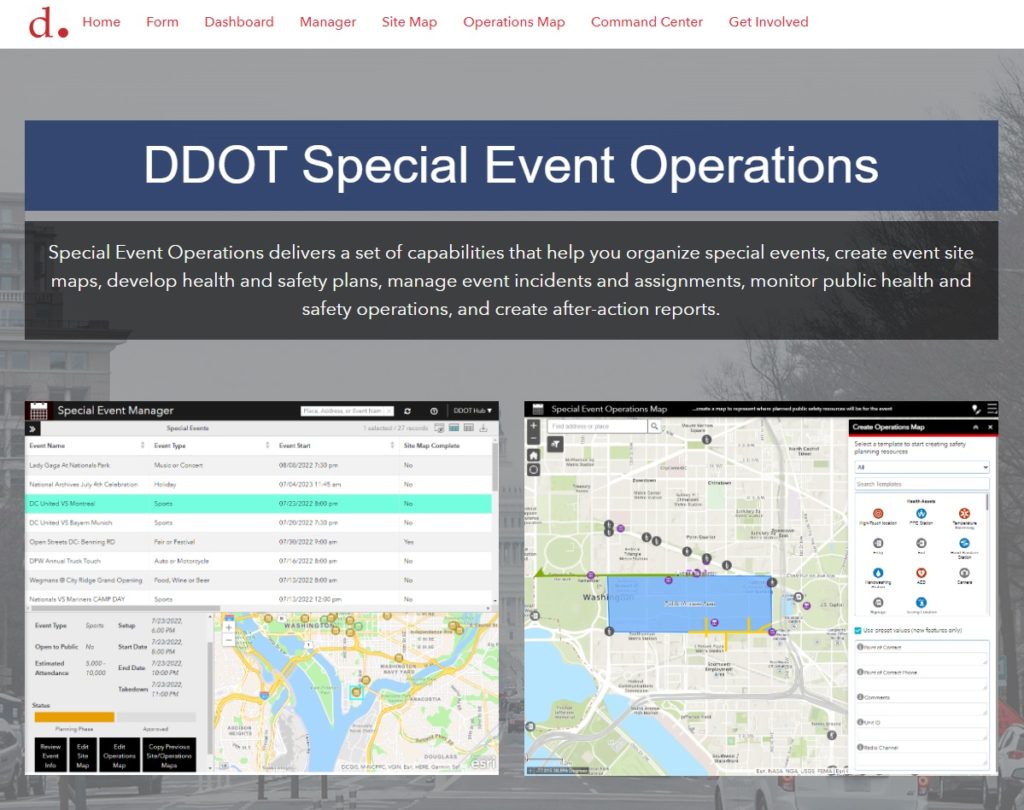
Esri’s Special Event Operations is a configurable solution that helps organize special events, create event site maps, develop health and safety plans, manage event incidents and assignments, monitor public health and safety operations, and create after-action reports. The District Department of Transportation (DDOT) recognized the value of having comprehensive information about an event in one authoritative, collaborative place, and asked SymGEO to help configure and deploy Special Event Operations for their internal use.
“The Special Events solution has sparked a new level of excitement in preparing for special events in the city. With SymGEO’s technical help, DDOT now has improved internal communication and decision-making abilities. The training provided by SymGEO has been super beneficial – they are a treasure!”
– DDOT Program Manager, Traffic Management Center
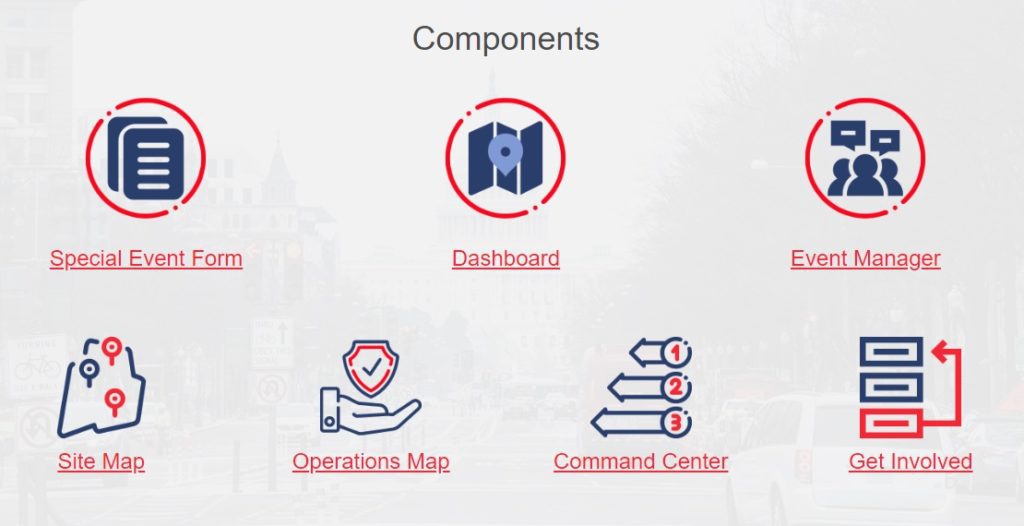
ArcGIS Hub was used to host the solution as it facilitated the understanding and workflow of how each individual component fits into the comprehensive picture.
The solution is built around a core data set of special events. Individual events are initially “registered” with the solution using an ArcGIS Survey123 intake form.
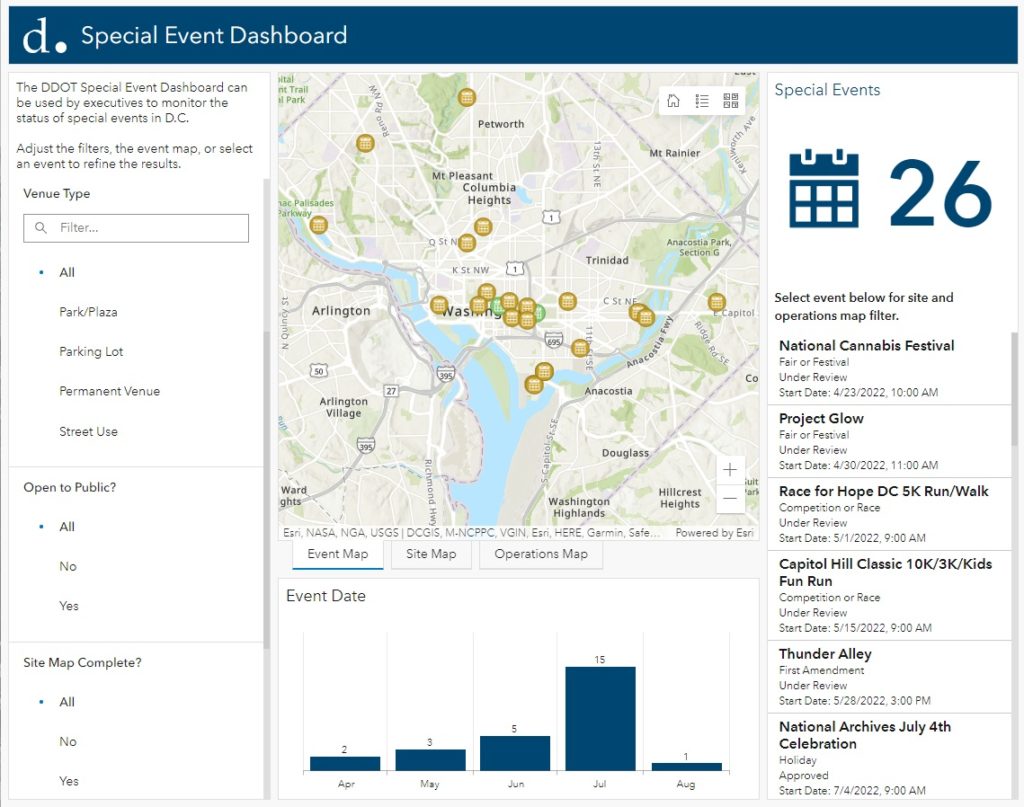
An ArcGIS Dashboard uses the event information to give managers an overview of upcoming (or past) events that can be filtered by venue type, expected crowd size, approval status, or other event characteristics.
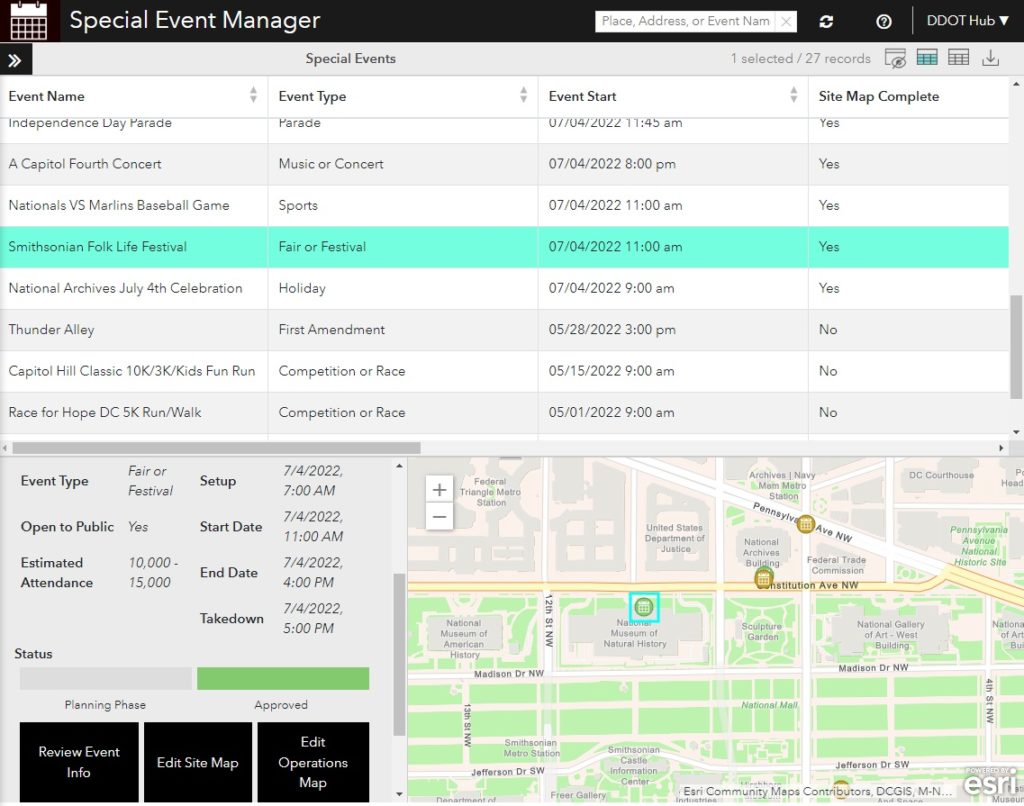
The Special Event Manager is used to dive deep into specific events. From this interface, site maps or operation maps can be created, copied from past events, reviewed, and eventually approved.
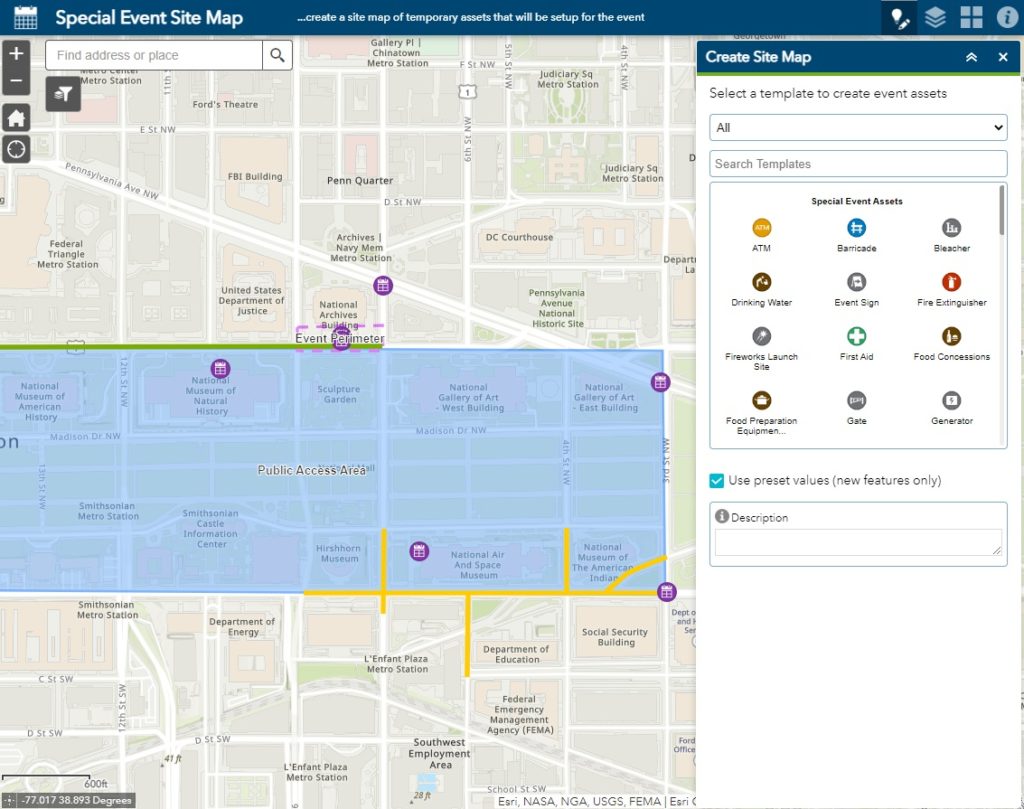
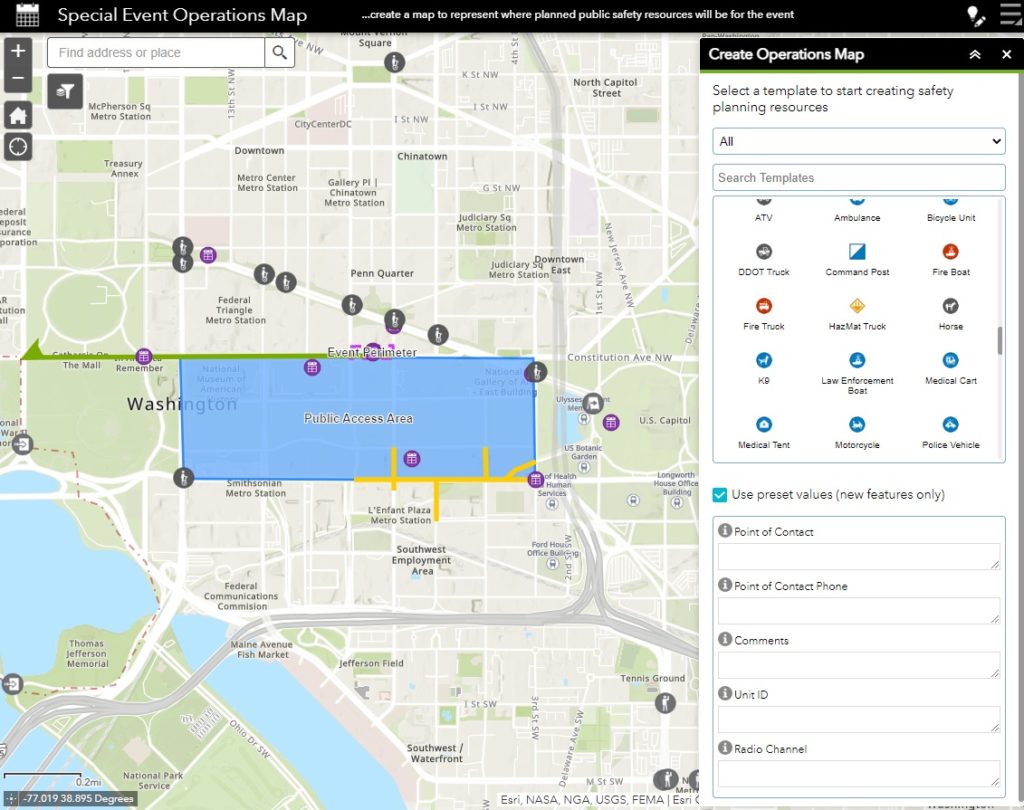
The Special Event Site Map interface facilitates the creation of site maps linked to individual events. Site maps include the point, line, or area representation of event physical features. This may include signs, fire lanes, event perimeters, or other stationary event components.
The operations map includes mobile or distributed resources that will be actively deployed during the event. This may include trucks, traffic control officers, resource assignment paths, staging areas, or security perimeters.
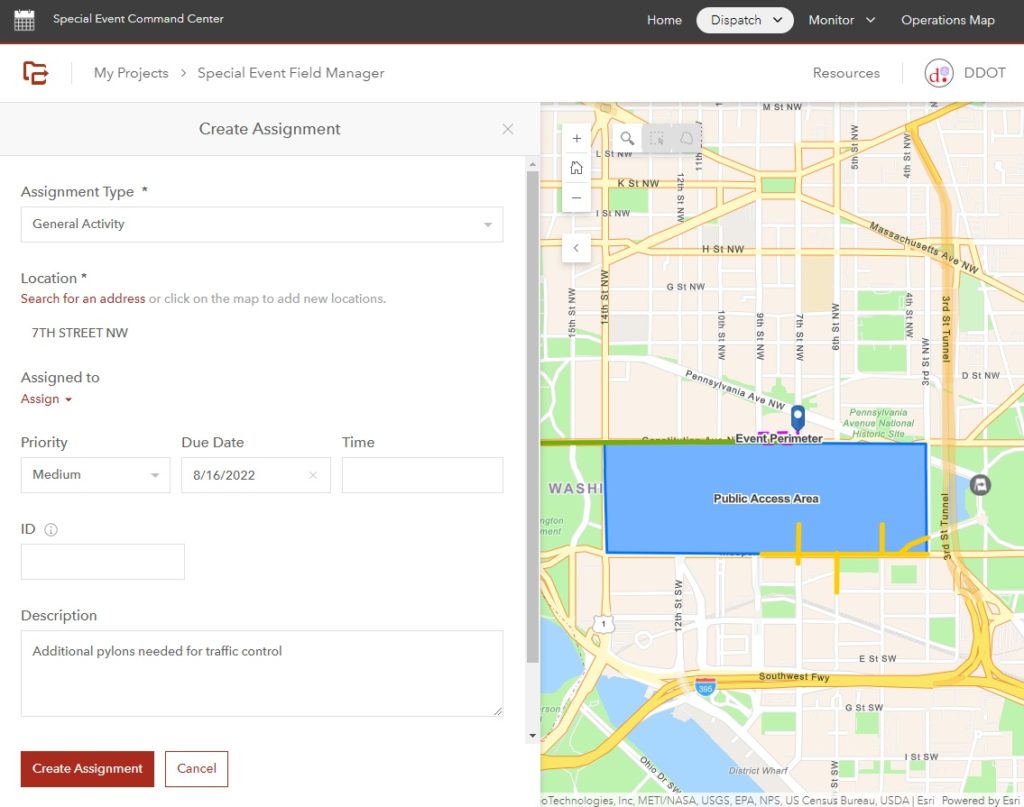
During an event, assignments can be created and assigned from the Special Event Command Center. Assignment deployment, tracking, and in-the-field responses are managed using ArcGIS Workforce behind the scenes.
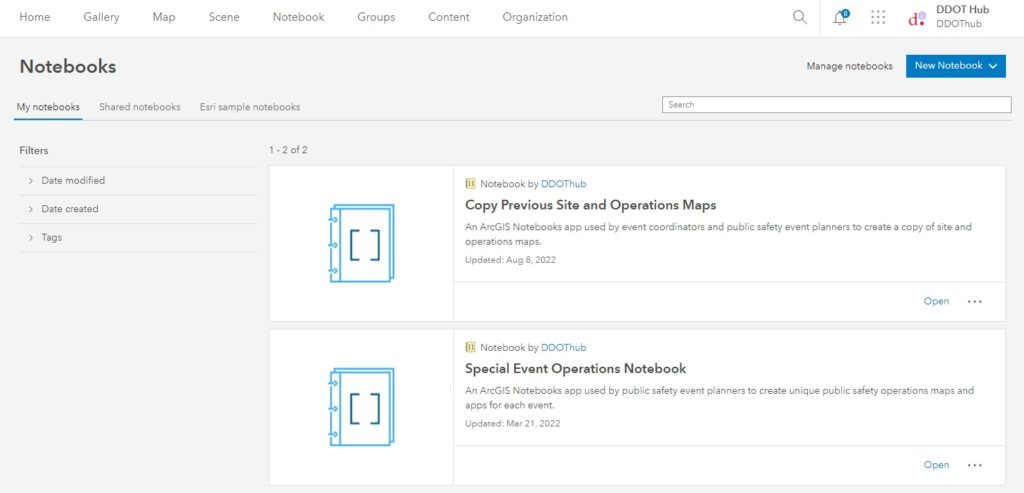
ArcGIS Notebooks are used to copy site plans and operations maps from previous events. This saves time, money, and the duplication of effort for annual or repeating events.
Talk to SymGEO today if your agency or organization is interested in managing special events using the power of Esri’s Special Event Operations solution – we are certified experts and here to help.
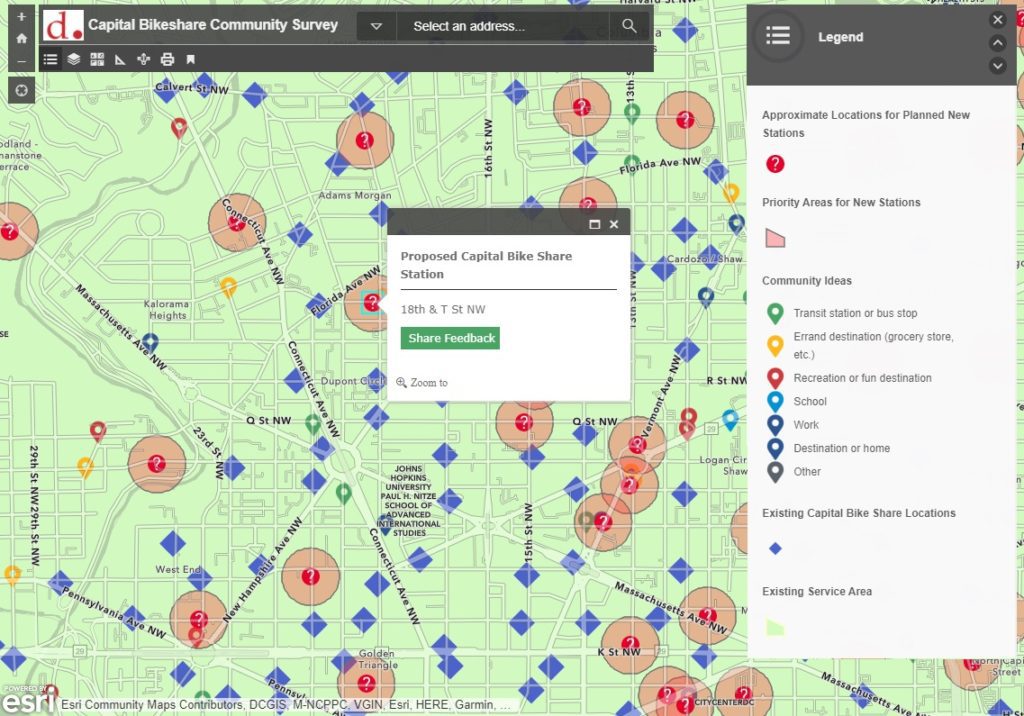
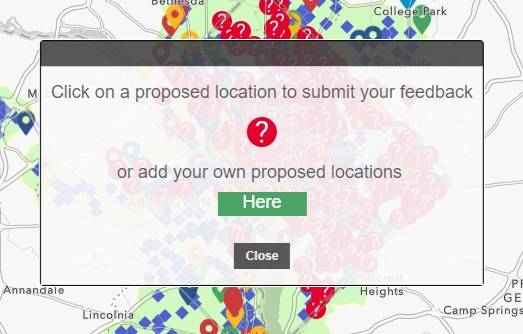
With 6000+ bikes covering 180+ square miles of the region, Capital Bikeshare is a great way to explore Metro DC and travel to and from various destination points. The network of 600+ bike stations is constantly expanding, and community feedback is an important part of deciding where to locate new stations. To facilitate the presentation of proposed locations to the general public and gather community feedback, SymGEO was honored to help build the Capital Bikeshare Station Request Tool using Esri’s ArcGIS Online technology. This work was featured in the Esri case study “GIS-Driven Initiatives Promote Active Transportation in Washington, DC“.
“The SymGEO team helped DDOT quickly implement a complex, public facing tool with a simple user interface to help us gather a high volume of public input data, which is extremely useful for Capital Bikeshare planning purposes. Their knowledge of GIS and ESRI products helped make a challenging project with many stakeholders simple and quick to turn around.”
– DDOT Project Manager
The tool leverages an ArcGIS web map and ArcGIS Web AppBuilder for the application as well as Survey123 for the gathering of comments on proposed bike stations, and it is hosted on ArcGIS Hub. Sharing feedback for a selected station opens a survey page for that station using URL parameters so that the comment is connected to the appropriate station.
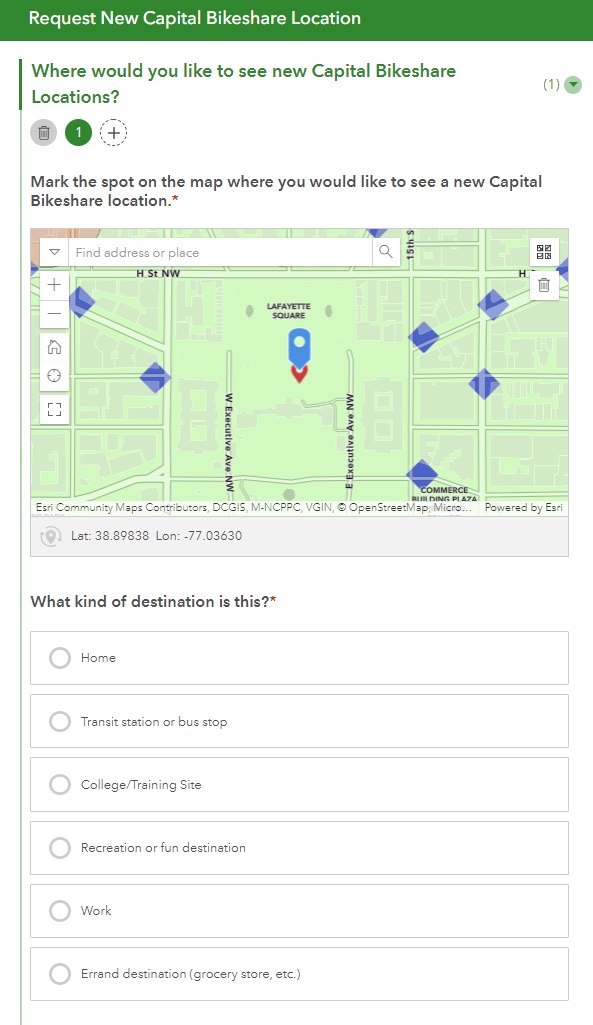
If a resident would like to suggest a location for a new site, an alternative survey is launched with additional data capture fields.
The Request New Capital Bikeshare Location survey was constructed using Survey123 Connect and offers the ability for a user to suggest multiple sites in the same submission.
“This is great stuff. Thanks again for pulling this together so quickly!”
– DDOT GIS and Applications Manager
Talk to SymGEO today if your agency or organization is interested in community engagement with the power of Esri’s ArcGIS Online platform – we are certified experts and here to help.
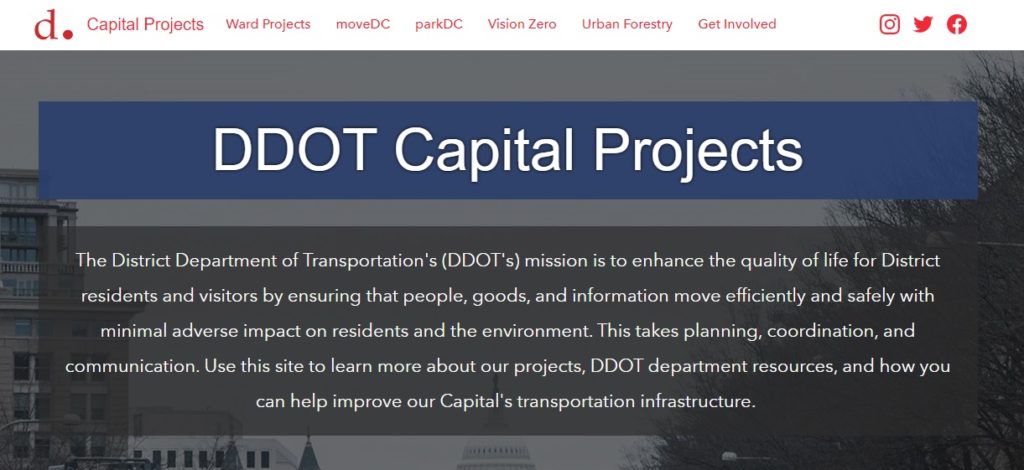
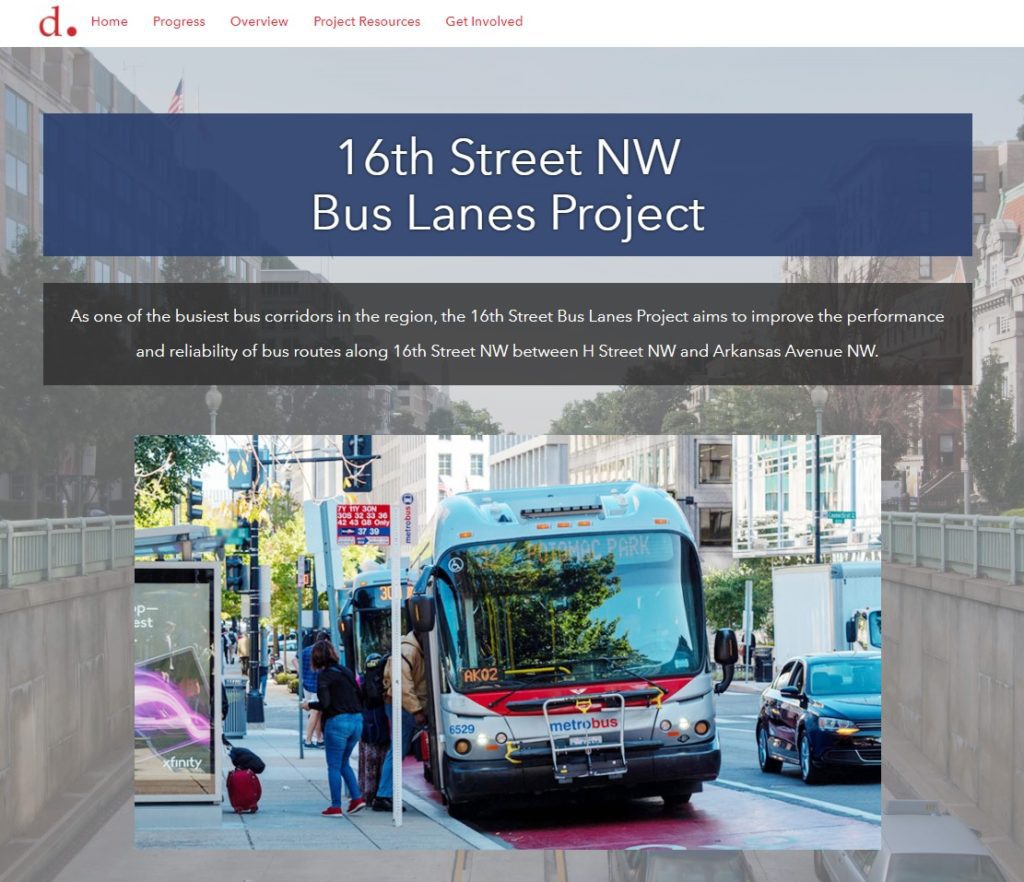
The District Department of Transportation’s (DDOT‘s) mission is to enhance the quality of life for District residents and visitors by ensuring that people, goods, and information move efficiently and safely with minimal adverse impact on residents and the environment. To accomplish this goal, many transportation capital projects are being funded, designed, and constructed throughout the city. To help organize and communicate capital project status and information, SymGEO collaboratively built an interactive engagement portal called DDOT Capital Projects using ArcGIS Hub technology.
“The SymGEO team has helped DDOT transform our digital presence into a highly engaging, well-organized platform. They leverage GIS best-practices and Esri technology to produce visually informative and actionable solutions.”
-DDOT Chief Performance Officer
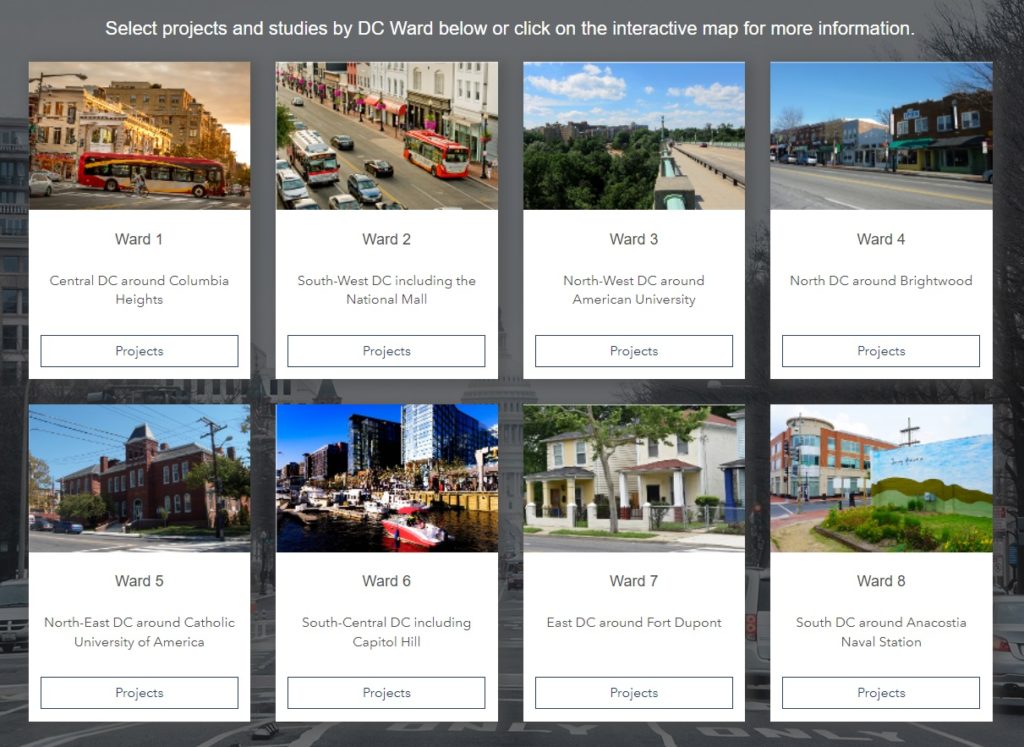
Projects are organized by Ward for easy access and discoverability by citizens or stakeholders.
Selecting a Ward will show which projects are currently underway or recently completed in the area.
Selecting an individual project unlocks a wealth of information about the project and provides a convenient one-stop-shop for all data and narratives about the project. SymGEO transferred existing content from legacy capital project websites, and project-specific contractors are now responsible for building and maintaining new project websites.
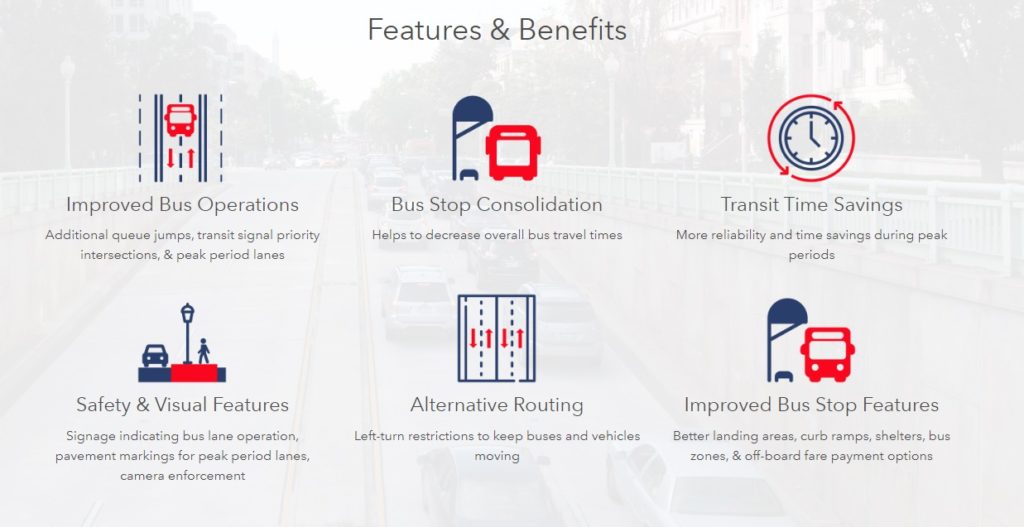
Project features and benefits are presented along with the expected project timeline, history, and associated public outreach material.
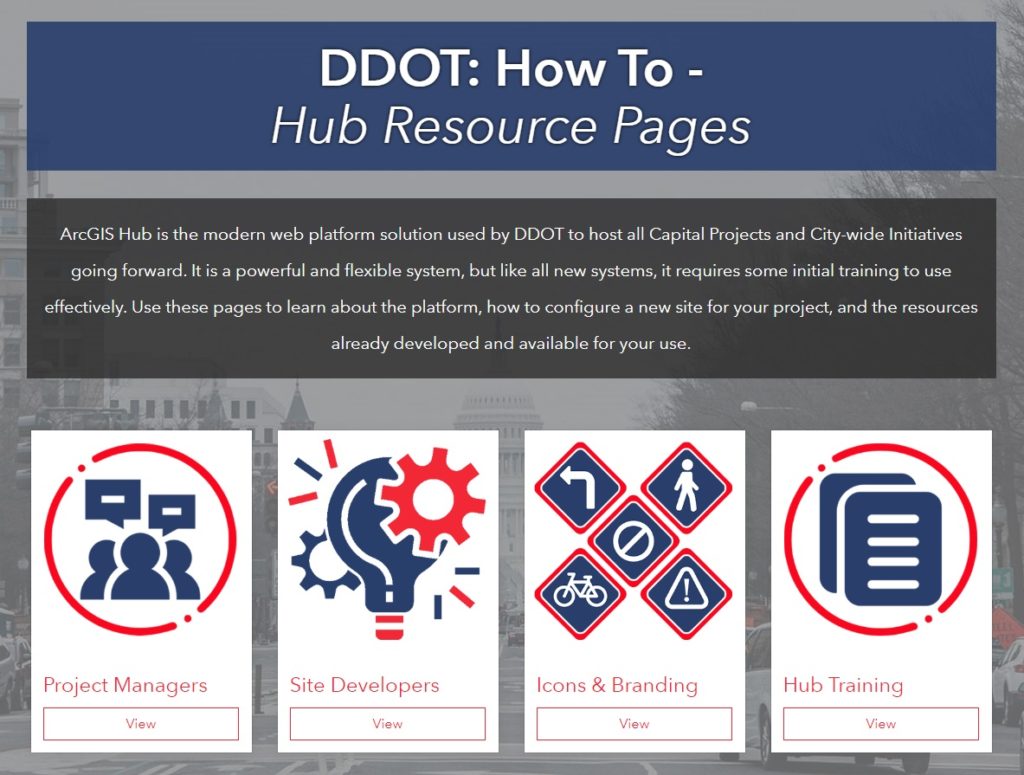
As this platform is relatively new to most consultants working on individual projects, SymGEO also produced a “how to” hub site that explains the process for Project Managers and Web Developers. Each project starts from the same standardized template, and branding guidelines are presented to help keep the sites consistent throughout the platform.
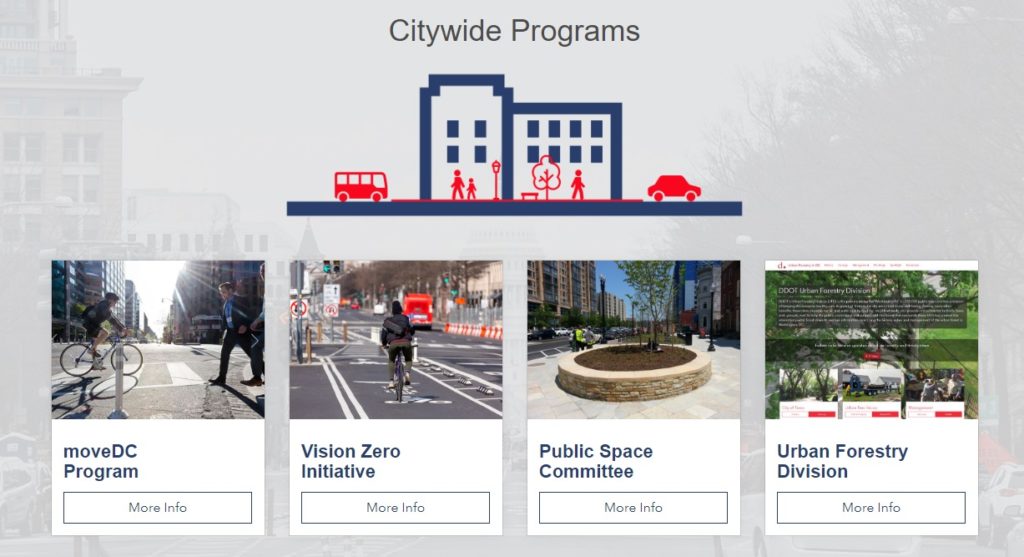
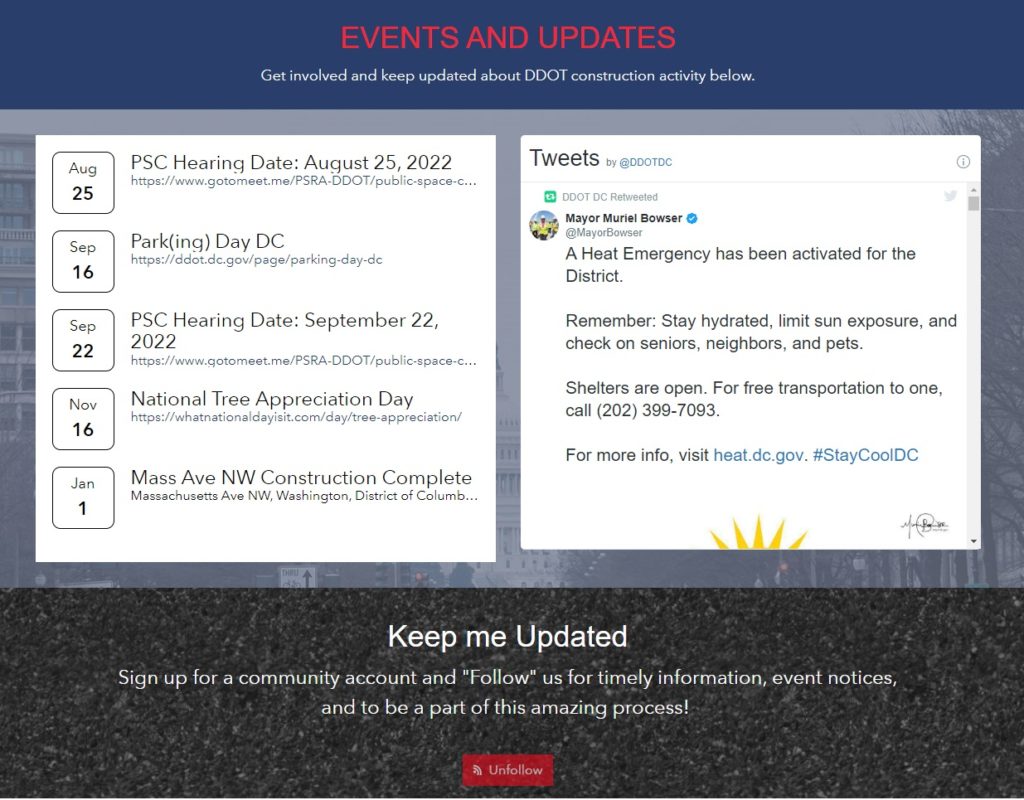
The main DDOT Capital Projects website also features citywide programs of interest to residents.
Events and updates are aggregated from individual projects and citywide programs to give a comprehensive picture of all that is happening throughout the city.
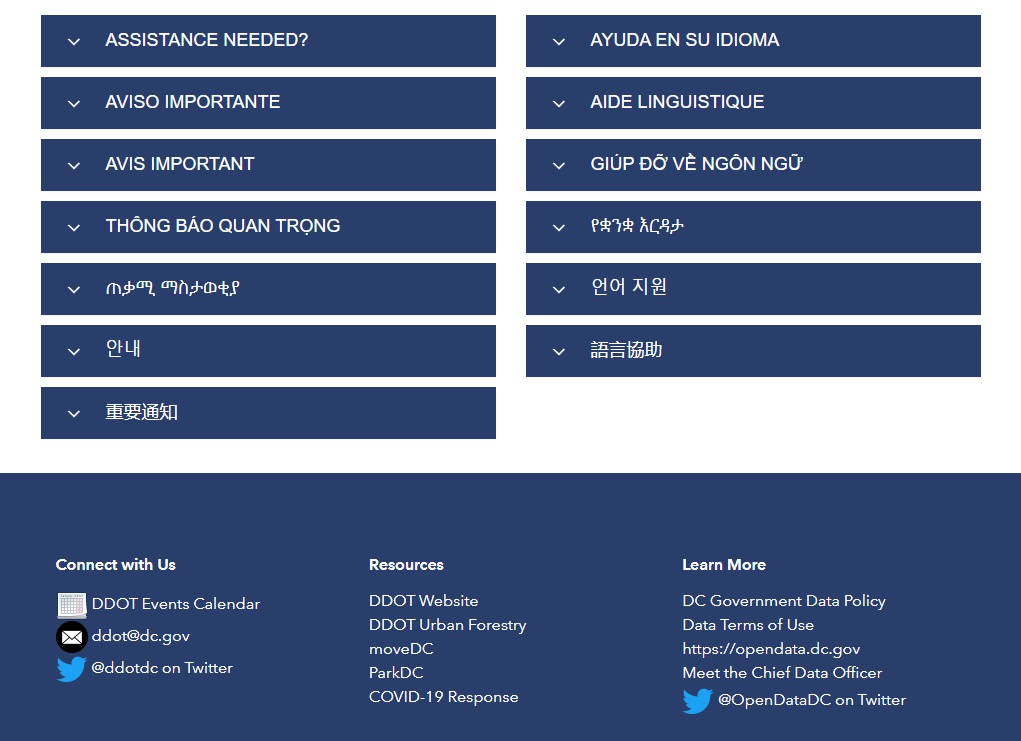
A custom footer provides important accessibility information and additional resources to discover.
Talk to SymGEO today if your agency or organization is interested in community engagement with the power of Esri’s ArcGIS Hub – we are certified experts and here to help.
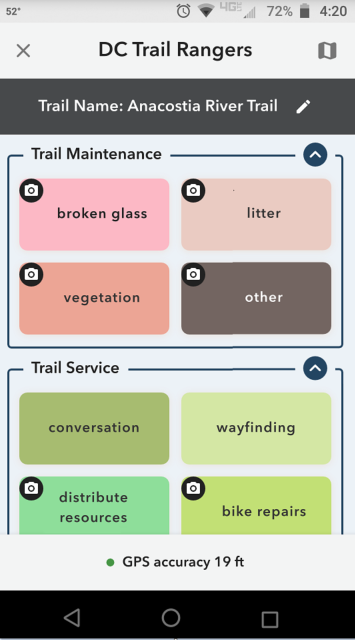
To help facilitate the data collection process and quantify work efforts, SymGEO was pleased to configure and deploy an ArcGIS QuickCapture application for the DC Trail Ranger team. Every trail service, maintenance task, work order request, or trail-side event is now captured by location with optional notes or photographs and tagged to the appropriate trail.
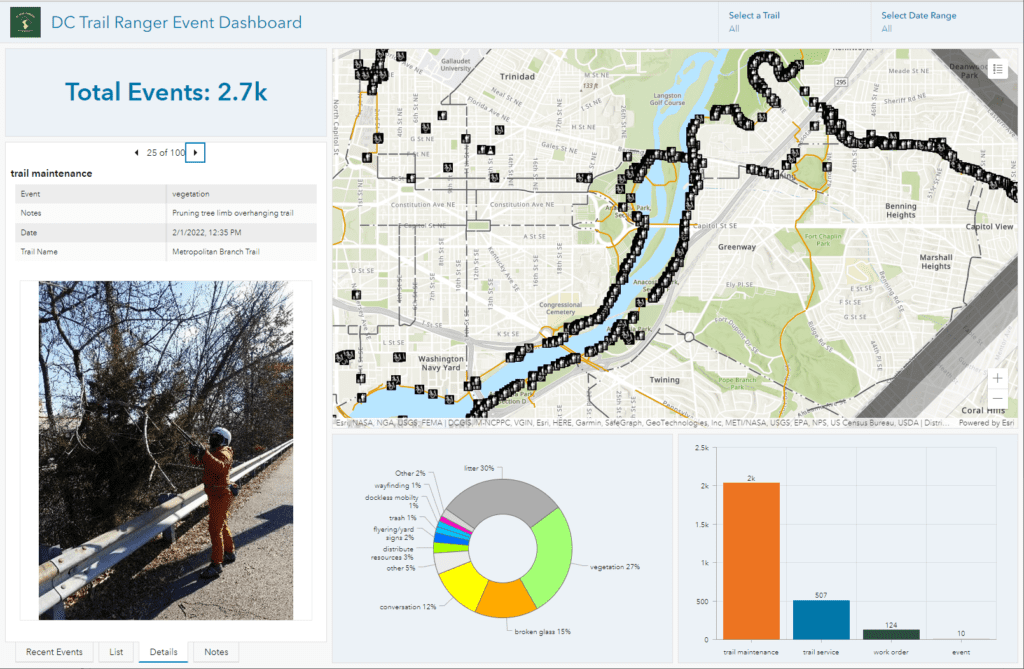
To assist with task management, the collected data was used to populate an internal ArcGIS Dashboard that lists all tasks and events by Trail Ranger and the date of the event. A public-facing version of the dashboard allows great visibility into all the activities undertaken by the Trail Rangers to better DC’s collective trail experience.
“As a field team that does a wide variety of outreach and maintenance tasks, ArcGIS QuickCapture has been great for record-keeping and storytelling of program impact. I can confidently say that staff stopped to sweep up broken glass in February 97 times!”
– Trail Ranger and Outreach Director, Washington Area Bicyclist Association
Talk to SymGEO industry experts today if your agency or organization is interested in data collection with the power of Esri’s ArcGIS QuickCapture technology – we are an award-winning, certified Esri business partner and are here to help.
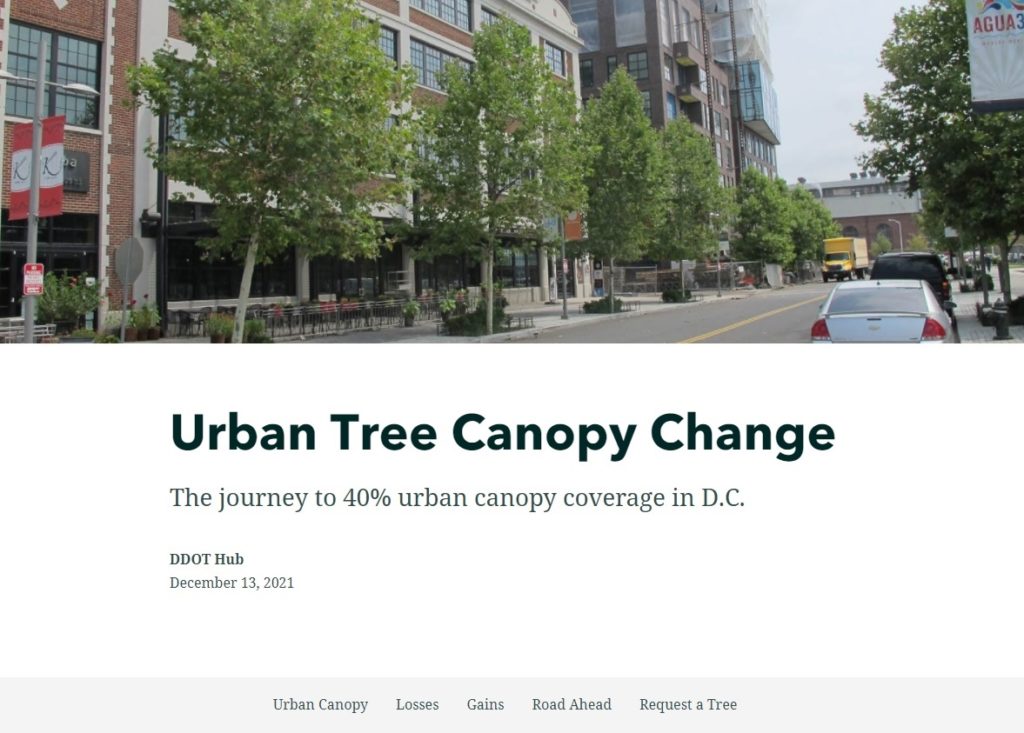
DDOT’s Urban Forestry Division (UFD) is the primary steward of Washington, D.C.’s ~175,000 public trees and has a mission of keeping this resource healthy, safe, and growing. Among many other benefits, these trees improve our air and water quality, cool our neighborhoods, and provide critical habitat for many animals. While D.C.’s Urban Tree Canopy (UTC) is already at an impressive 38%, the UFD has a goal of 40% by 2032. To learn more about the gains and losses experienced during the journey to 40%, SymGEO recently partnered with the UFD to create a StoryMap that explores example areas throughout D.C. and lays out the steps needed to reach the 40% canopy coverage goal.
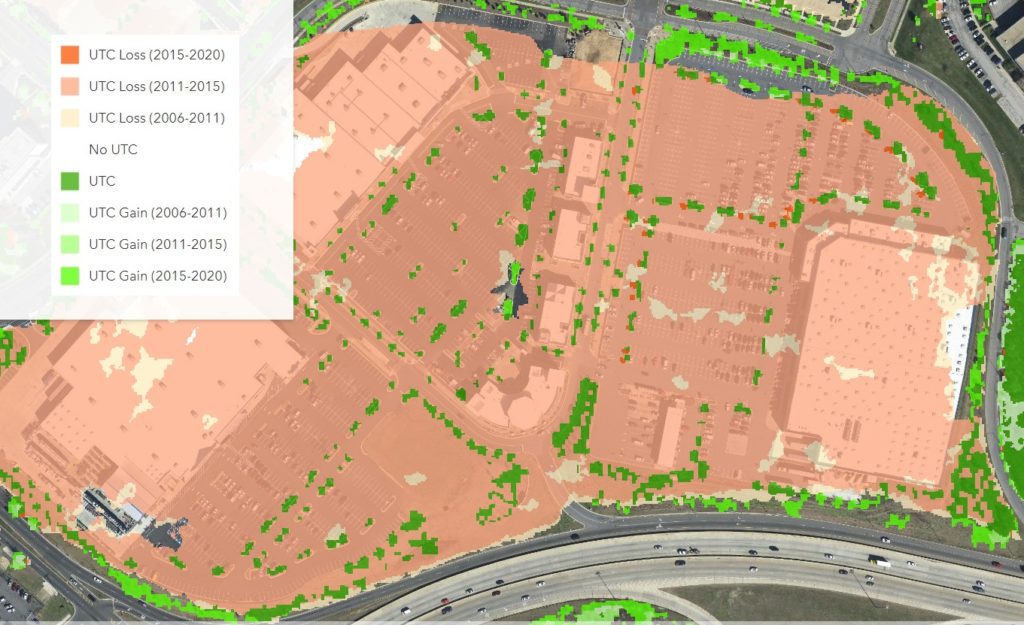
This mobile-responsive story begins with an overview of the current canopy coverage in DC and explores select examples detailing areas of loss and areas of gain.
Areas of loss are typically due to commercial developments, new residential developments, supporting road and transportation infrastructure, or individual tree loss due to natural causes or storm damage.
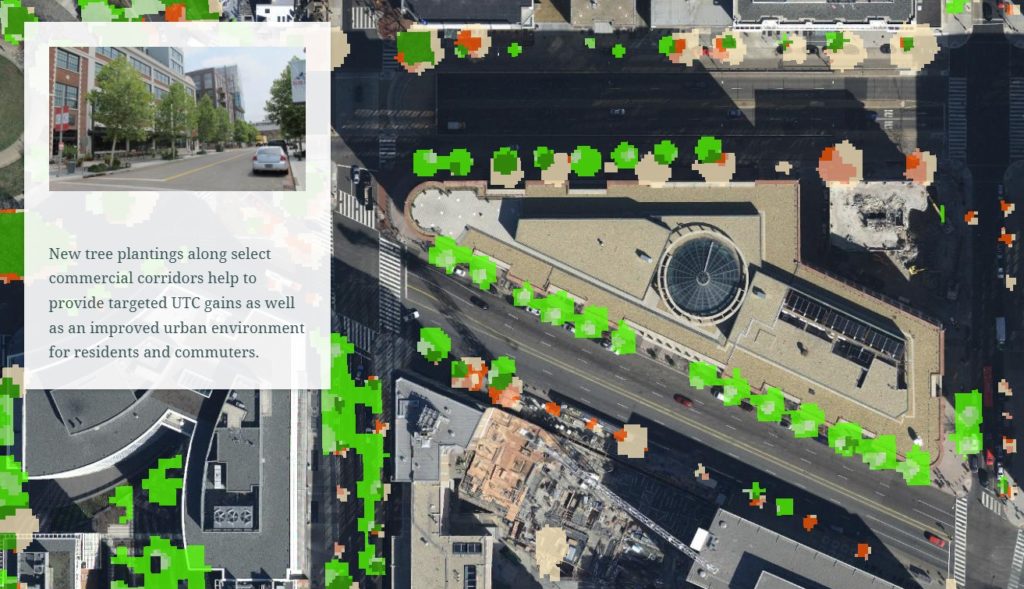
Areas of gain can be attributed to plantings along commercial corridors, or in new residential developments to help alleviate the urban heat island effect, or due to the natural growth of trees over time.
Finally, a call to action is made for homeowners to request their own free shade-providing tree, or to report an open planting box ready for a new tree.
Talk to SymGEO industry experts today if your agency or organization is interested in community engagement with the power of Esri’s ArcGIS StoryMap technology – we are a certified Esri business partner and are here to help.
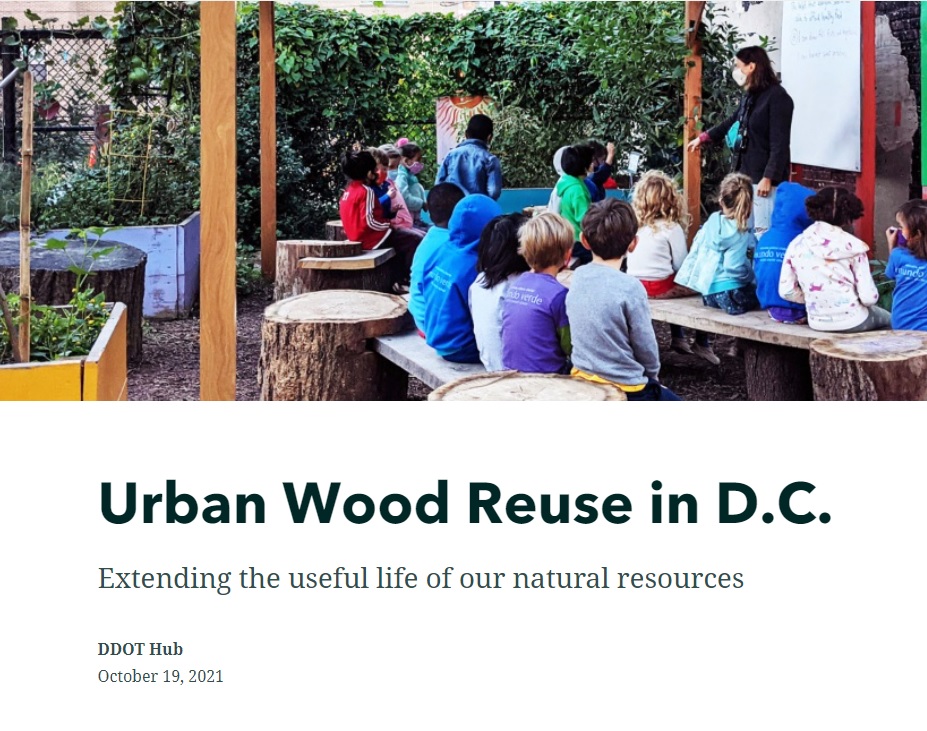
Did you know that the Urban Forestry Division (UFD) in Washington D.C. offers schools and parks the opportunity to enjoy a variety of useful products to improve school grounds and parks at no cost? Made from upcycled public trees, these finely crafted benches, stumps, and other seating structures serve as living classrooms and natural storage lockers for carbon, all the while connecting students to the natural resources around them. Learn more about this fantastic program with a new StoryMap produced by SymGEO in collaboration with UFD below.
Talk to our industry experts today if your agency or organization is interested in community engagement with the power of Esri’s ArcGIS StoryMap technology – SymGEO is a certified Esri business partner and is here to help.
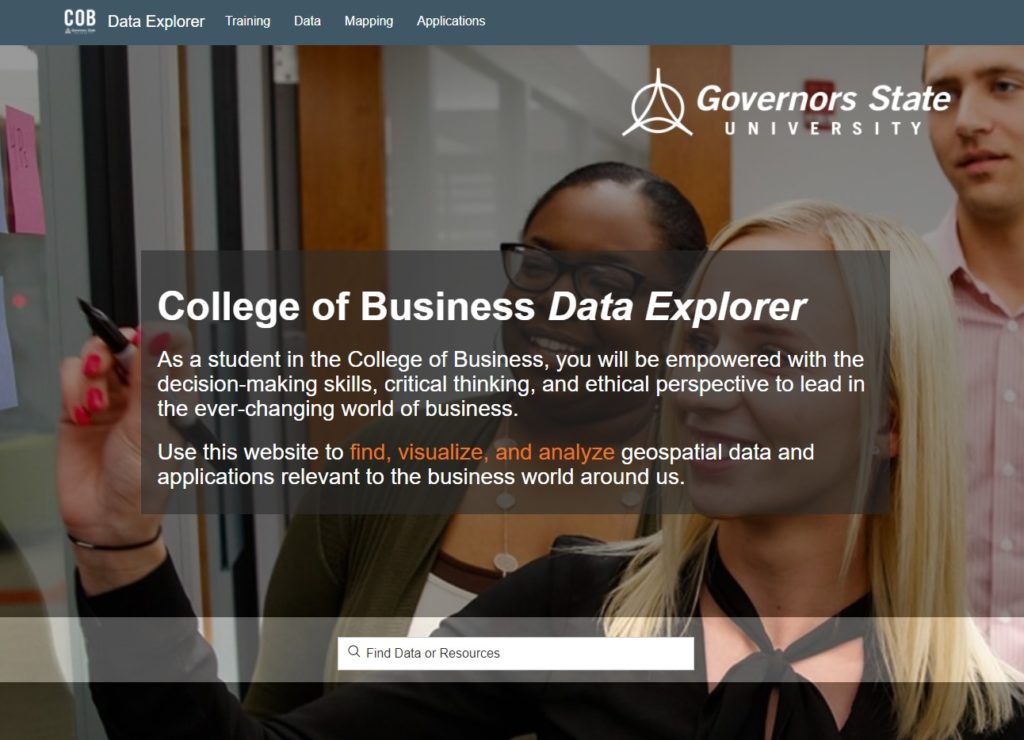
Collaboration and using the best available data are keys to success at academic institutions, so it’s no surprise that ArcGIS Hub technology offers a smart solution to a perennial challenge. The Governors State University College of Business recently engaged with SymGEO to build their internal GIS capabilities and learn more about ArcGIS Hub collaborative opportunities. The result is the pilot GSU COB Data Explorer Hub site, available for students and faculty to explore and engage with Esri geospatial technology and the larger GIS community.
The Data Explorer Hub site focuses on training opportunities available through Esri that are directly applicable to the school of business.
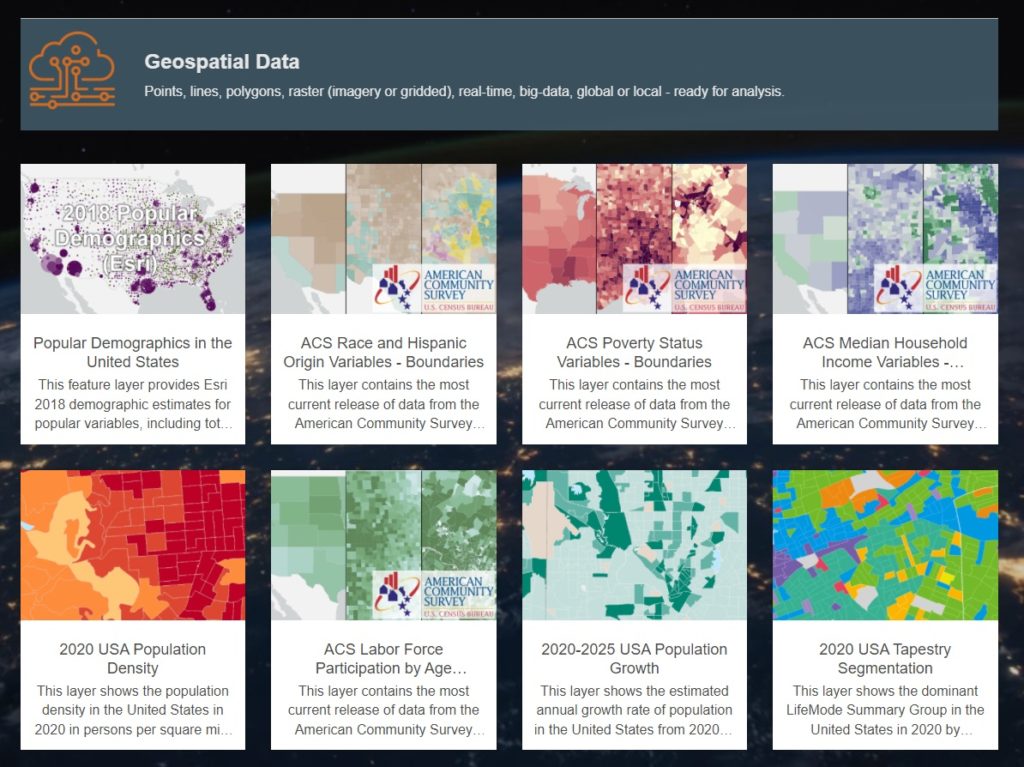
Numerous data sets, mapping layers, and interactive web applications are also presented to encourage students and staff to think about the many ways that GIS technology can be incorporated into their classes, research, or grant writing processes.
Talk to SymGEO industry experts today if your academic institution or organization is interested in community engagement with the power of Esri’s ArcGIS Hub – we are here to help.